Line drawing outside the graph limit
Open
- Dominant language
- Swift
- Stars
- 28k
- Forks
- 6k
- PR merge metrics
- No merged PRs in 30d
Description
The line in the graph in some situations that the amount is high enough or too low the line is being drawn outside the limits of the graph, as the image below shows.
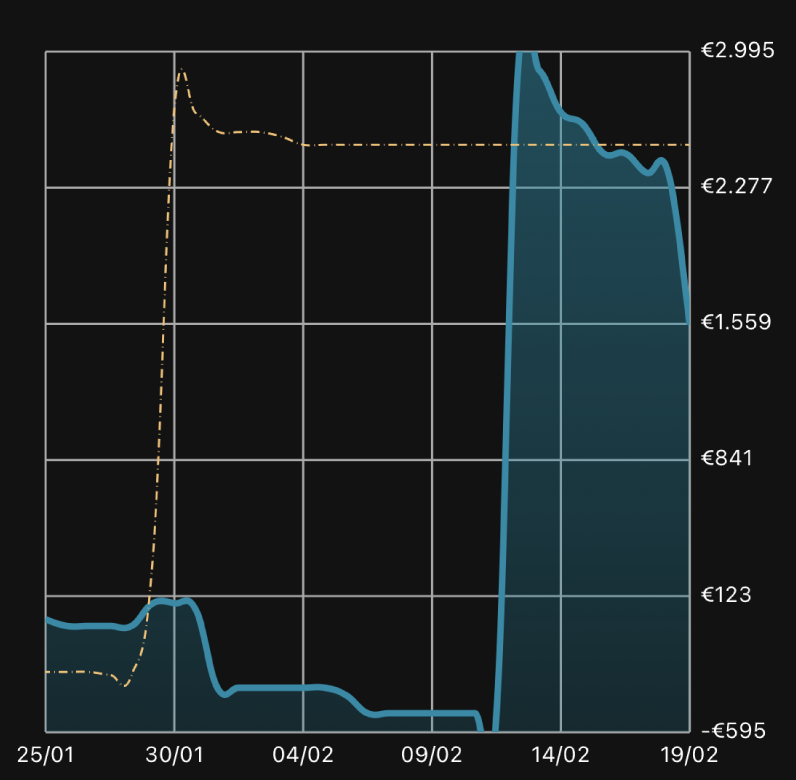
I tried to apply some offset to the xAxis with no success, this data that is outside the boundaries is the .right data.
Does anyone have any clue which property I should change in order for it to work as it should?
Contributor guide
Research direction
Start by reproducing the graph with very high and very low values, comparing the plotted line with the xAxis boundaries shown in the attached screenshot. Trace the chart's line and axis-limit handling; done means the line stays within the graph bounds for both extreme-value cases.
Written by the indexing model from the issue text.
Assessment
- Tech stack
- swift
- Domain
- data-visualization, mobile-dev
- Issue type
- Bug
- Difficulty
- 3/5
- Estimated time
- 1-2 days
- Activity status
- Stale
- Clarity
- Needs clarification
- Newbie friendliness
- 25/100