Adjust the xAxis labels for a time-based plot
- Dominant language
- Swift
- Stars
- 28k
- Forks
- 6k
- PR merge metrics
- No merged PRs in 30d
Description
* [x] I've read, understood, and done my best to follow the [*CONTRIBUTING guidelines](https://github.com/jjatie/Charts/blob/master/CONTRIBUTING.md).
## What did you do?
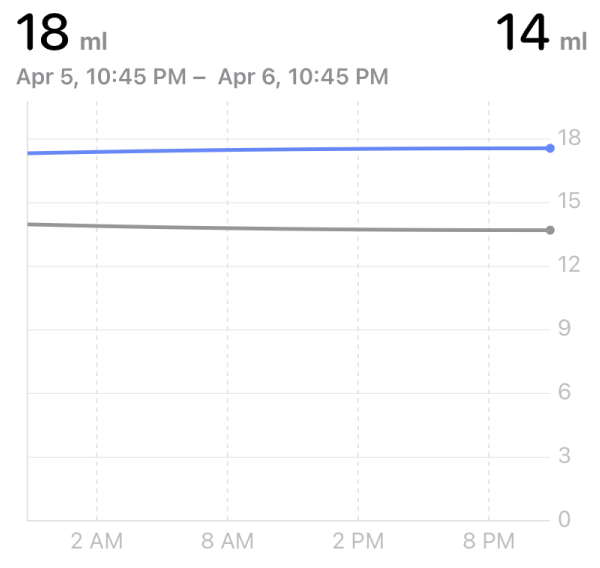
I'm trying to build a chart similar to the Health app where time starts at 00 and has intervals at 06, 12, 16 and 24.
I'm using the following options:
`uiView.xAxis.granularity = 3600*6 // 6 hours
uiView.setVisibleXRange(minXRange: 24*3600, maxXRange: 24*3600)
uiView.xAxis.labelCount = 4
uiView.xAxis.centerAxisLabelsEnabled = false`
The xAxis.axisMinimum is set to 10 years in the past at 31 December 2011, 0:00.
I have an axis formatter that formats the chart value like this:
`// 12 hour clock
formatter.dateFormat = "h a"
// 24 hour clock
formatter.dateFormat = "HH"`
The chart looks like this:
## What did you expect to happen?
As I'm using the axisMinimum with a time of 0:00, I'm expecting the time labels to be 6AM, 12PM, 18PM, etc.
## What happened instead?
The times displayed are always 4PM and 8PM. Whatever I set the date to, I always get these labels. Changing the xAxis's axisMinimum doesn't change the labels. Am I missing something?
## Charts Environment
**Charts version/Branch/Commit Number: 3.6.0**
**Xcode version: 12.4**
Contributor guide
Assessment
This issue has not been assessed yet.