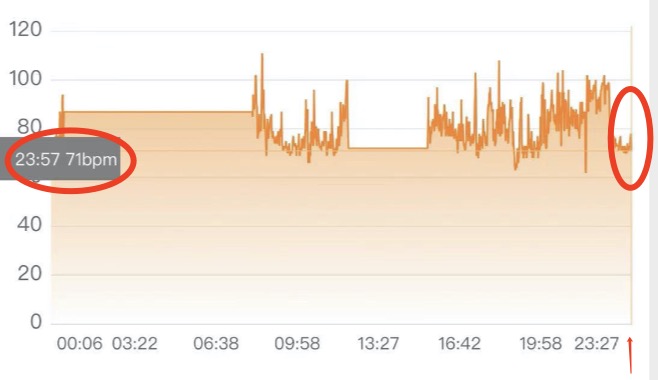
When the chart data is very big(eg:1213),How to show the last data in the xAxis?
Open
- Dominant language
- Swift
- Stars
- 28k
- Forks
- 6k
- PR merge metrics
- No merged PRs in 30d
Description
If i use the labelCount,the xAxis will be divided into equal parts,but i need the last data 23:57 show in the xAxis
Contributor guide
Assessment
This issue has not been assessed yet.