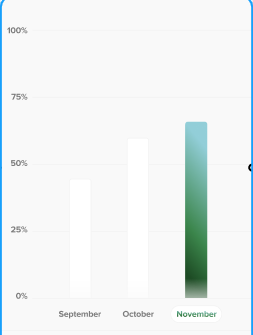
One label per one bar
- Dominant language
- Swift
- Stars
- 28k
- Forks
- 6k
- PR merge metrics
- No merged PRs in 30d
Description
I want a single label only per single bar and also I want the same label on the y-axis with 0 to 100 with 25 of the gap in each step.
## What did you do?
chartView.chartDescription?.enabled = false
chartView.dragEnabled = false
chartView.setScaleEnabled(false)
chartView.pinchZoomEnabled = false
chartView.drawBarShadowEnabled = false
chartView.rightAxis.enabled = false
chartView.rightAxis.drawAxisLineEnabled = false
chartView.drawBordersEnabled = false
chartView.legend.form = .none
let xAxis = chartView.xAxis
xAxis.drawGridLinesEnabled = false
xAxis.drawAxisLineEnabled = false
xAxis.labelPosition = .bottom
xAxis.labelFont = .boldFont(13)
xAxis.labelTextColor = .darkGray
let leftAxisFormatter = NumberFormatter()
leftAxisFormatter.minimumFractionDigits = 0
leftAxisFormatter.maximumFractionDigits = 1
leftAxisFormatter.negativeSuffix = "%"
leftAxisFormatter.positiveSuffix = "%"
let leftAxis = chartView.leftAxis
leftAxis.drawAxisLineEnabled = false
leftAxis.labelFont = .boldFont(13)
leftAxis.labelTextColor = .darkGray
leftAxis.valueFormatter = DefaultAxisValueFormatter(formatter: leftAxisFormatter)
## What did you expect to happen?
## What happened instead?
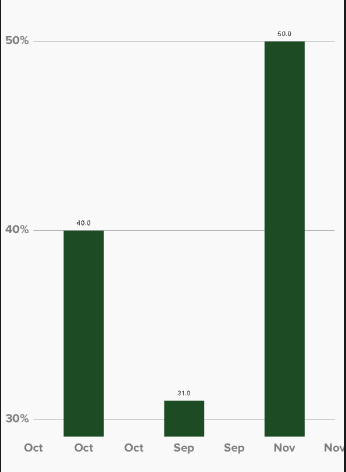
Issues I have:
-It shows multiple labels on the x-axis with the same text
-It also shows that grid line as well. I want to remove it
-I want the y-axis to be fixed values from 0 to 100 with 25 of margin in between.
I want to remove that extra X-Axis labels other than what it's below the bar and also I want 0 to 100% with 25% of the range between them and remove that grid lines.
## Charts Environment
**Charts version/Branch/Commit Number:** 3.6.0
**Xcode version:** XCode 12
**Swift version:** Swift 5.3
Contributor guide
Research direction
Start with the chartView.xAxis and chartView.leftAxis configuration shown in the issue, then read the axis-label, grid-line, and value-range behavior for Charts 3.6.0. Reproduce the setup and determine whether the reported duplicate labels, grid line, and 0–100% range can be configured; done means one label per bar, no unwanted grid line, and 25% intervals from 0 to 100%.
Written by the indexing model from the issue text.
Assessment
- Tech stack
- swift
- Domain
- data-visualization, mobile
- Issue type
- Bug
- Difficulty
- 3/5
- Estimated time
- 1-2 days
- Activity status
- Stale
- Clarity
- Mostly clear
- Newbie friendliness
- 35/100