Linear Gradient Fill not updating when viewport changes (Chart zoom in/out or pan)
- Dominant language
- Swift
- Stars
- 28k
- Forks
- 6k
- PR merge metrics
- No merged PRs in 30d
Description
> ℹ Please fill out this template when filing an issue.
> All lines beginning with an ℹ symbol instruct you with what info we expect. You can delete those lines once you've filled in the info.
>
> Per our [*CONTRIBUTING guidelines](https://github.com/jjatie/Charts/blob/master/CONTRIBUTING.md), we use GitHub for
> bugs and feature requests, not general support. Other issues should be opened on Stack Overflow with the tag [`ios-charts`.](https://stackoverflow.com/questions/tagged/ios-charts)
>
> Please remove this line and everything above it before submitting.
* [X] I've read, understood, and done my best to follow the [*CONTRIBUTING guidelines](https://github.com/jjatie/Charts/blob/master/CONTRIBUTING.md).
## What did you do?
Added a Filled horizontal linear gradient to a LineChart's dataSet then zoomed in and panned the view.
```swift
// I use swiftui but here's a general idea of the config I've given the chart
let lineChartView = LineChartView()
let chartDataSet = LineChartDataSet( entries: [
ChartDataEntry(x: 1.0, y: 5.0),
ChartDataEntry(x: 2.0, y: 10.0),
ChartDataEntry(x: 3.0, y: 20.0),
ChartDataEntry(x: 4.0, y: 15.0),
ChartDataEntry(x: 5.0, y: 0.0),
])
chartDataSet.drawCirclesEnabled = false
chartDataSet.drawCircleHoleEnabled = false
chartDataSet.drawFilledEnabled = true
chartDataSet.drawHorizontalHighlightIndicatorEnabled = false
chartDataSet.drawIconsEnabled = false
chartDataSet.drawVerticalHighlightIndicatorEnabled = false
chartDataSet.fillAlpha = 255
chartDataSet.highlightEnabled = false
chartDataSet.lineWidth = 0
chartDataSet.valueFont = .systemFont(ofSize: 9)
let gradient = CGGradient(
colorsSpace: nil,
colors: [UIColor.red.cgColor, UIColor.red.cgColor, UIColor.blue.cgColor, UIColor.blue.cgColor, UIColor.green.cgColor] as CFArray,
locations: [0.0, 0.3, 0.3, 0.6, 0.6]
)
chartDataSet.fill = Fill.fillWithLinearGradient(gradient!, angle: 0.0)
lineChartView.data = LineChartData(dataSet: chartDataSet)
lineChartView.dragYEnabled = false
lineChartView.legend.enabled = false
lineChartView.rightAxis.enabled = false
lineChartView.scaleYEnabled = false
lineChartView.xAxis.labelPosition = .bottom
```
## What did you expect to happen?
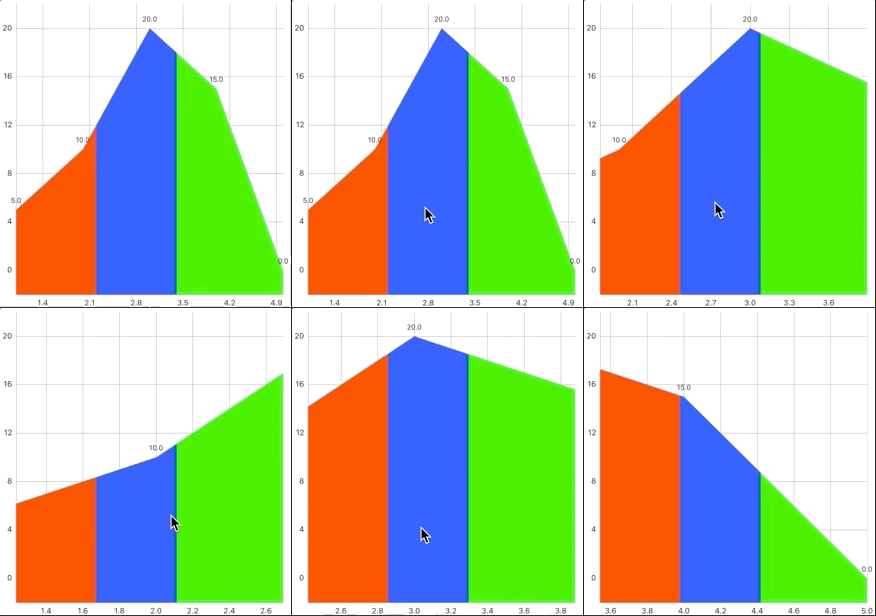
I expected the linear gradient to stretch and shrink with the change of scale for the Line
## What happened instead?
The linear gradient ratios are stuck to the bounds of the chart, not the dataset
`GIF Below`
## Charts Environment
**Charts version/Branch/Commit Number:** 3.6
**Xcode version:** 12.1
**Swift version:** 5
**Platform(s) running Charts:**
iOS 13.5, iOS: 14.1
**macOS version running Xcode:**
## Demo Project
ℹ Please link to or upload a project we can download that reproduces the issue.
TBA (I can add one later in my spare time with storyboard if requested)
Contributor guide
Assessment
This issue has not been assessed yet.