How to get the maximum and minimum values of data in YAxisRenderer?
- Dominant language
- Swift
- Stars
- 28k
- Forks
- 6k
- PR merge metrics
- No merged PRs in 30d
Description
## What did you do?
I draw different grid background colours(according to #645), but I need to use the maximum and minimum values to determine the range of different colors. Different colors are determined by the data.
(Example: 20 or more is excellent, 20 or less is ordinary. So when the value is in the excellent range, the grid background is green, and when the value is in the normal range, it is yellow.)
## What did you expect to happen?
According to #645, it may have to be drawn in YAxisRenderer,but in the YAxisRenderer class, I cannot find the property or method to get the minimum value.
Can I get the line data in YAxisRenderer, or get the maximum and minimum values? If not, how do you suggest me to get and set it up?
## What happened instead?
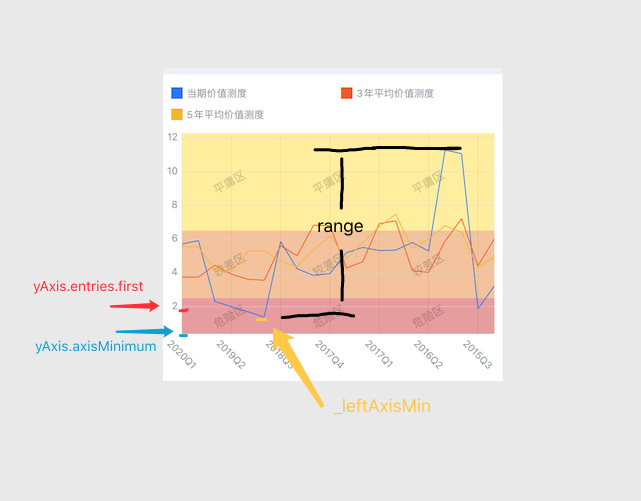
I can get yAxis.entries.first and yAxis.axisMinimum, but they are not accurate, as shown in the figure.
What I want to get is the **range** in the picture.
## Charts Environment
**Charts version/Branch/Commit Number:** 3.5.0
**Xcode version:** 11.5
Contributor guide
Assessment
This issue has not been assessed yet.