Radar Chart does not respect yMin-Max
- Dominant language
- Swift
- Stars
- 28k
- Forks
- 6k
- PR merge metrics
- No merged PRs in 30d
Description
* [x ] I've read, understood, and done my best to follow the [*CONTRIBUTING guidelines](https://github.com/jjatie/Charts/blob/master/CONTRIBUTING.md).
## What did you do?
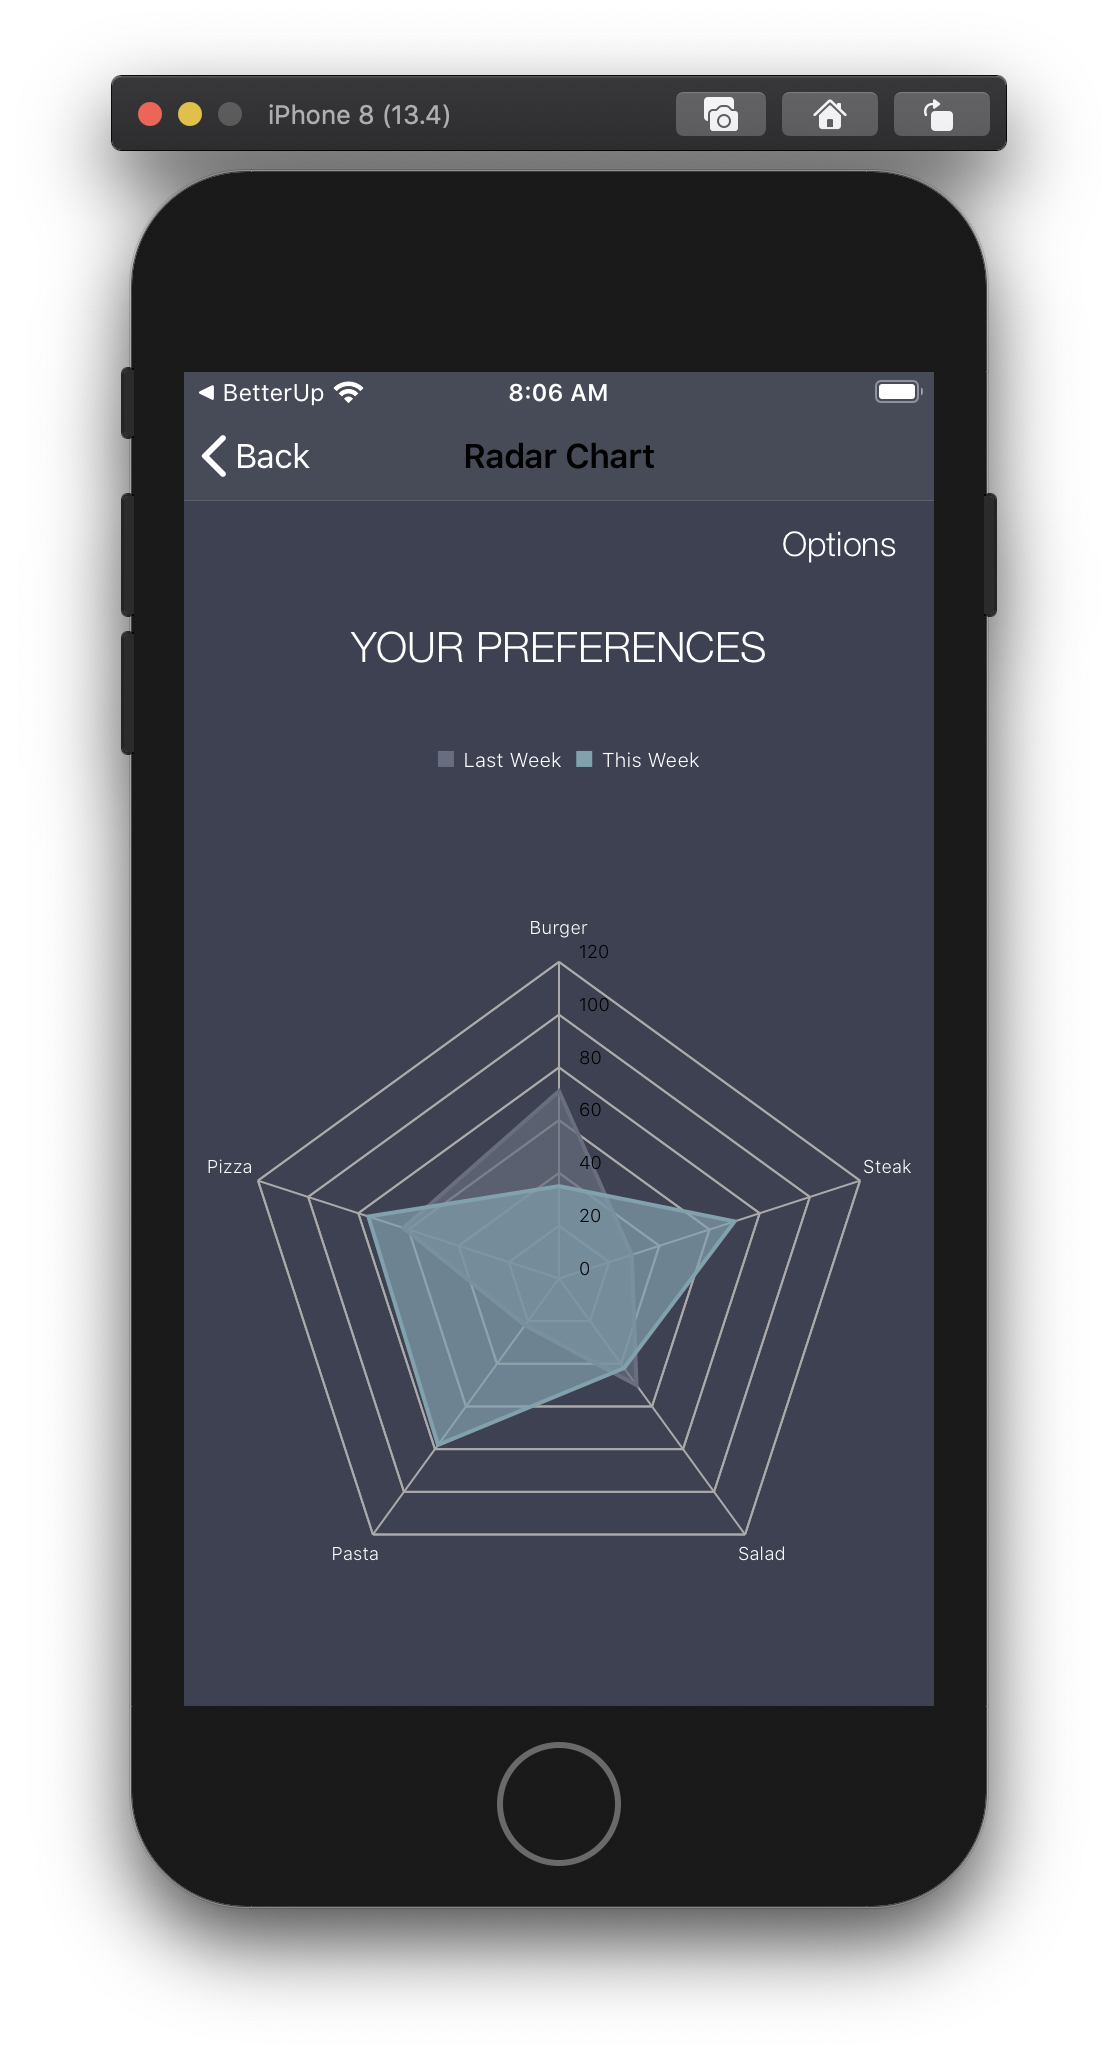
After setting the yAxis Min/Max, the yMax shown on the radar chart is greater than the set value.=
## What did you expect to happen?
I expect when yMax is set for the chart to only show chart lines up to that max and not beyond
## What happened instead?
The chart is choosing to show its own range
## Charts Environment
**Charts Release 3.5.0**
**Xcode version: 11.5**
**Swift version: 5**
**Platform(s) running Charts: iOS Sim iPhone 8**
**macOS version running Xcode: 10.15.5**
## Demo Project
1. Open the Demo Xcode workspace provided
2. Launch Demo-Swift on iPhone 8 sim
3. Select Radar Chart
4. Turn on y-axis labels
5. Check the configuration code
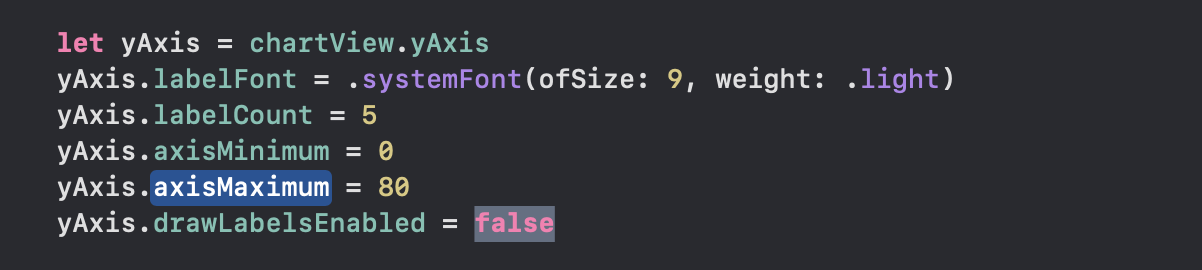
As you can see 4 and 5 are mismatched. The code says the max should be 80 but the chart shows a max of 120
Expected:
* The max value shown on the chart should be 80.
* The number of labels shown to new 5 (code setting) and not 7 (chart render)
Contributor guide
Assessment
This issue has not been assessed yet.