BarChart formatting
Open
- Dominant language
- Swift
- Stars
- 28k
- Forks
- 6k
- PR merge metrics
- No merged PRs in 30d
Description
For a Bar Chart
I have 4 data sets making 4 series per Xaxis value
1) How does one set the Legend Text Color currently black but I would prefer a black background
2) How does one set the bar's value again it's black
3) How does one have a stacked Bar chart
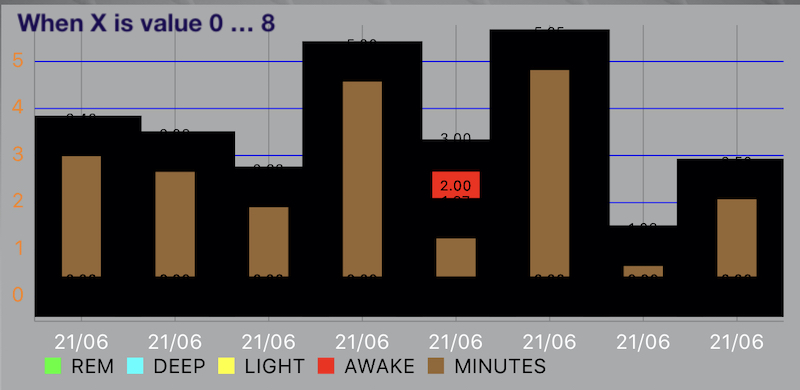
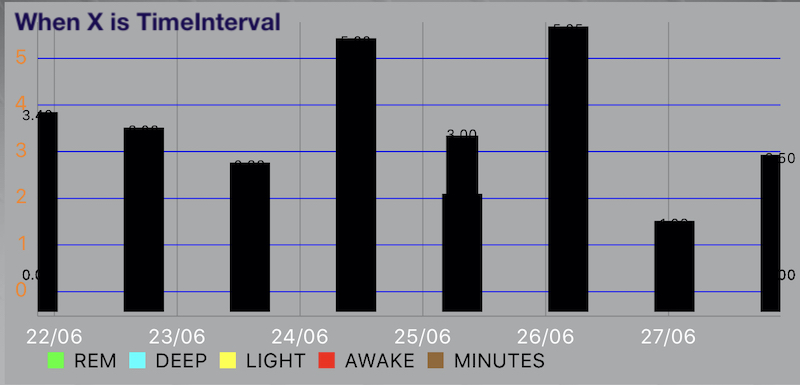
4) If I use x value of 1...7 then each bar is color coded to the dataset.colors. However if I use x values as timeIntervalSince1970 then bars are all black
Contributor guide
Assessment
This issue has not been assessed yet.