Y-Axis missing labels when all plotted values are equal
- Dominant language
- Swift
- Stars
- 28k
- Forks
- 6k
- PR merge metrics
- No merged PRs in 30d
Description
✔️ I've read, understood, and done my best to follow the [*CONTRIBUTING guidelines](https://github.com/jjatie/Charts/blob/master/CONTRIBUTING.md).
## What did you do?
I've created a line chart, plotting (say) weight data, averaged by month. This can result in a graph where the average is the same for each month plotted.
The chart has the y-axes configured as follows…
```
rightAxis.setLabelCount(3, force: true)
rightAxis.drawLabelsEnabled = true
leftAxis.drawLabelsEnabled = false
leftAxis.drawGridLinesEnabled = false
leftAxis.spaceBottom = .zero
leftAxis.spaceTop = .zero
```
## What did you expect to happen?
Even when all values are the same I'd expect to see labels on the right axis.
## What happened instead?
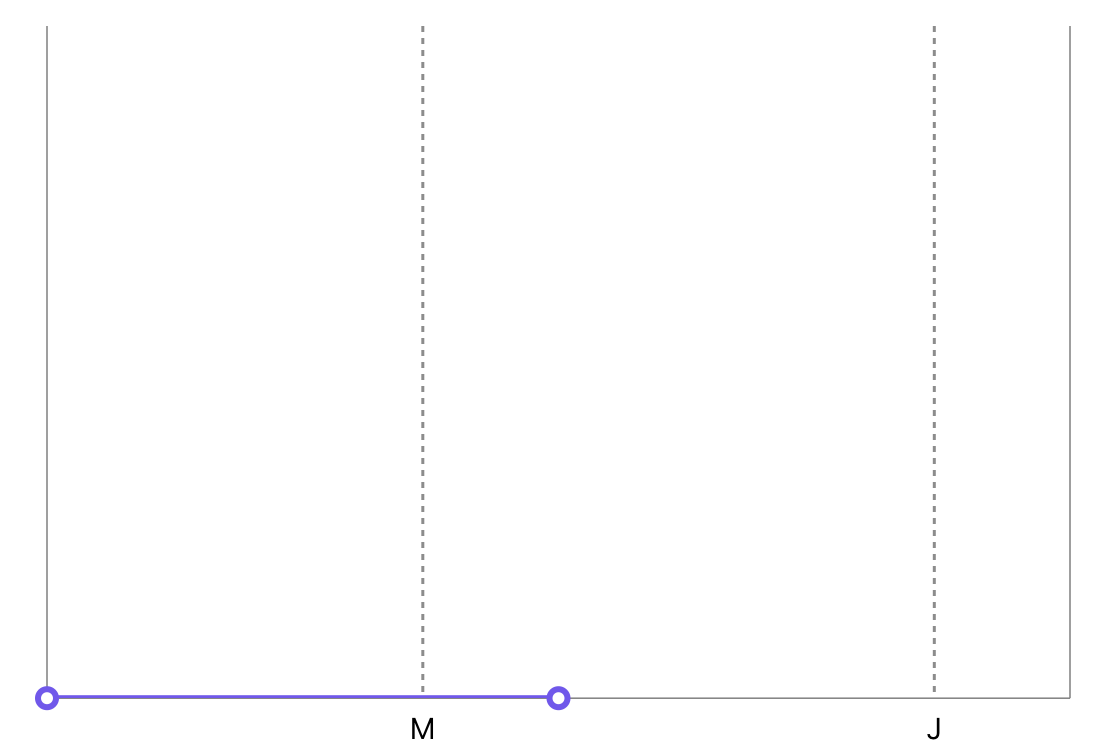
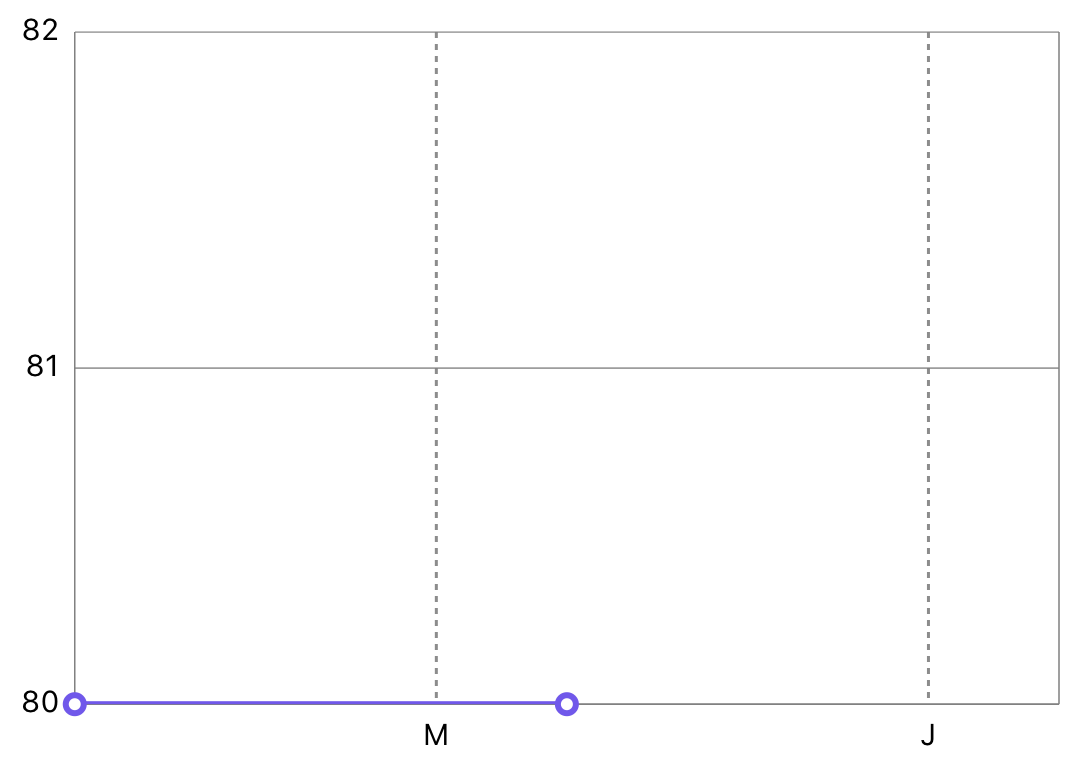
When all values are the same, the right axis doesn't show any labels. If I swap the configuration of the axes, the left axis shows labels as expected.
### Right axis (no labels ❌)
### Left axis (shows labels ✅)
## Charts Environment
**Charts version/Branch/Commit Number:** 3.4.0
**Xcode version:** 11.4.1
**Swift version:** 5.2
**Platform(s) running Charts:** iOS 13.4.1
**macOS version running Xcode:** 10.15.4
Contributor guide
Research direction
Reproduce the issue in Charts 3.4.0 with a line chart whose plotted values are all equal, using the reported right- and left-axis settings. Start by tracing how axis labels are calculated and rendered for equal ranges; done means the right axis displays labels consistently with the left axis.
Written by the indexing model from the issue text.
Assessment
- Tech stack
- swift
- Domain
- data-visualization
- Issue type
- Bug
- Difficulty
- 3/5
- Estimated time
- 1-2 days
- Activity status
- Stale
- Clarity
- Mostly clear
- Newbie friendliness
- 45/100