Radar chart: How can I fill the background color of radar chart and set the value of yAxis to be maximum of 100 not more than that?
Open
- Dominant language
- Swift
- Stars
- 28k
- Forks
- 6k
- PR merge metrics
- No merged PRs in 30d
Description
I want to fill the background color of radar chart. Ho can i do that? Also, when I am setting the RadarChartDataSet entry to 100, the yAxis of radar chart increase to 120. How can I set it to not exceed the maximum value of 100.
Below is the screenshot for the radar chart with first data entry set to 90:
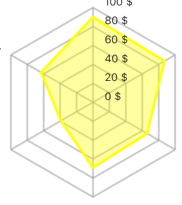
and below is the screenshot for the radar chart with first data entry set to 100, it creates another y-axis of value 120:

Contributor guide
Assessment
This issue has not been assessed yet.