Bar chart: bars are floating
- Dominant language
- Swift
- Stars
- 28k
- Forks
- 6k
- PR merge metrics
- No merged PRs in 30d
Description
* [x] I've read, understood, and done my best to follow the [*CONTRIBUTING guidelines](https://github.com/jjatie/Charts/blob/master/CONTRIBUTING.md).
I am creating a grouped bar chart, and for some reason my bars are floating above the 0-point. But it only happens with certain values.
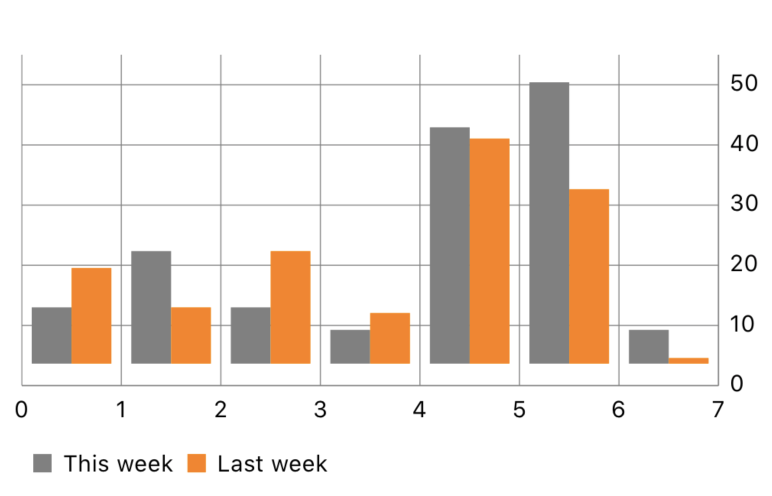
A minimum repro example:
``` swift
import UIKit
import Charts
class ViewController: UIViewController {
@IBOutlet private var chartView: BarChartView!
let groupSpace = 0.2
let barSpace = 0.0
let barWidth = 0.4
override func viewDidLoad() {
super.viewDidLoad()
view.backgroundColor = .white
configure()
}
func configure() {
chartView.xAxis.labelPosition = .bottom
chartView.xAxis.axisMinimum = 0
chartView.xAxis.axisMaximum = 7
chartView.leftAxis.enabled = false
chartView.rightAxis.axisMinimum = 0
let currentValues = [
BarChartDataEntry(x: 0, y: 10),
BarChartDataEntry(x: 1, y: 20),
BarChartDataEntry(x: 2, y: 10),
BarChartDataEntry(x: 3, y: 6),
BarChartDataEntry(x: 4, y: 42),
BarChartDataEntry(x: 5, y: 50),
BarChartDataEntry(x: 6, y: 6),
]
let currentValuesSet = BarChartDataSet(entries: currentValues, label: "This week")
currentValuesSet.setColor(UIColor.gray)
currentValuesSet.drawValuesEnabled = false
let previousValues = [
BarChartDataEntry(x: 0, y: 17),
BarChartDataEntry(x: 1, y: 10),
BarChartDataEntry(x: 2, y: 20),
BarChartDataEntry(x: 3, y: 9),
BarChartDataEntry(x: 4, y: 40),
BarChartDataEntry(x: 5, y: 31),
BarChartDataEntry(x: 6, y: 1),
]
let previousValuesSet = BarChartDataSet(entries: previousValues, label: "Last week")
previousValuesSet.setColor(UIColor.orange)
previousValuesSet.drawValuesEnabled = false
let data = BarChartData(dataSets: [currentValuesSet, previousValuesSet])
data.highlightEnabled = false
data.barWidth = barWidth
data.groupBars(fromX: 0, groupSpace: groupSpace, barSpace: barSpace)
chartView.data = data
}
}
```
## Charts Environment
Charts 3.4.0, via Cocoapods. iOS 13.3, Xcode 11.3.1.
Contributor guide
Research direction
Start with the supplied Swift minimum reproduction, especially ViewController.configure(), and run it with Charts 3.4.0 on the stated iOS environment. Compare the grouped bars against the configured zero point for the listed values; done means the bars consistently begin at zero rather than floating above it.
Written by the indexing model from the issue text.
Assessment
- Tech stack
- ios, swift
- Domain
- data-visualization, mobile-dev
- Issue type
- Bug
- Difficulty
- 3/5
- Estimated time
- 1-2 days
- Activity status
- Stale
- Clarity
- Clearly specified
- Newbie friendliness
- 48/100