How to set BarChartView Stacked position to horizontal?
- Dominant language
- Swift
- Stars
- 28k
- Forks
- 6k
- PR merge metrics
- No merged PRs in 30d
Description
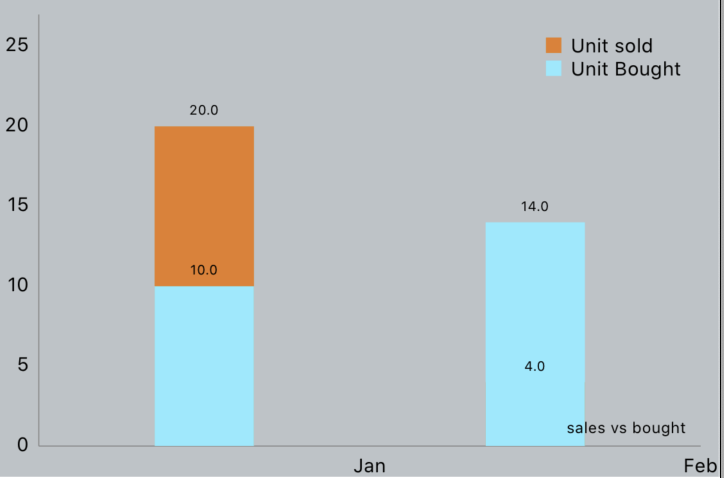
I have one requirement for one my app. I have to display the bar chart.
For each x -> Multiple y entires. Bars should not be stacked on top of each bar. I want to show the bars side by side for each x entries.
```
extension ViewController {
private func configureChart() {
// barChartView.delegate
barChartView.noDataText = "You need to provide data for the chart."
barChartView.chartDescription?.text = "sales vs bought "
//legend
let legend = barChartView.legend
legend.enabled = true
legend.horizontalAlignment = .right
legend.verticalAlignment = .top
legend.orientation = .vertical
legend.drawInside = true
legend.yOffset = 10.0;
legend.xOffset = 10.0;
legend.yEntrySpace = 0.0;
let xaxis = barChartView.xAxis
// xaxis.valueFormatter = axisFormatDelegate
xaxis.drawGridLinesEnabled = false
xaxis.labelPosition = .bottom
xaxis.centerAxisLabelsEnabled = true
xaxis.valueFormatter = IndexAxisValueFormatter(values:self.months)
xaxis.granularity = 1
let leftAxisFormatter = NumberFormatter()
leftAxisFormatter.maximumFractionDigits = 1
let yaxis = barChartView.leftAxis
yaxis.spaceTop = 0.35
yaxis.axisMinimum = 0
yaxis.drawGridLinesEnabled = false
barChartView.rightAxis.enabled = false
//axisFormatDelegate = self
setChart()
}
func setChart() {
barChartView.noDataText = "You need to provide data for the chart."
let dataEntries: [BarChartDataEntry] = [BarChartDataEntry(x: 0, yValues: self.unitsSold)]
let dataEntries1: [BarChartDataEntry] = [BarChartDataEntry(x: 0, yValues: self.unitsBought)]
let chartDataSet = BarChartDataSet(entries: dataEntries, label: "Unit sold")
let chartDataSet1 = BarChartDataSet(entries: dataEntries1, label: "Unit Bought")
let dataSets: [BarChartDataSet] = [chartDataSet, chartDataSet1]
chartDataSet.colors = [UIColor(red: 230/255, green: 126/255, blue: 34/255, alpha: 1)]
let chartData = BarChartData(dataSets: dataSets)
let barWidth = 0.3
chartData.barWidth = barWidth;
barChartView.notifyDataSetChanged()
barChartView.data = chartData
barChartView.backgroundColor = UIColor(red: 189/255, green: 195/255, blue: 199/255, alpha: 1)
//chart animation
barChartView.animate(xAxisDuration: 1.5, yAxisDuration: 1.5, easingOption: .linear)
}
}
```
Output:
Expected Output:
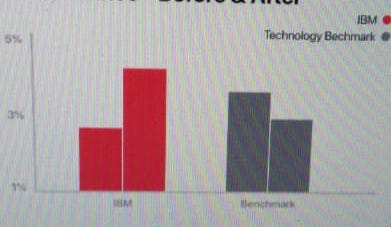
How to do this?
Contributor guide
Research direction
Review the configureChart and setChart snippets, focusing on BarChartDataSet, BarChartData, the x values, and barWidth. Done means the Unit sold and Unit Bought datasets render side by side for each x entry, matching the expected output rather than stacking.
Written by the indexing model from the issue text.
Assessment
- Tech stack
- swift
- Domain
- data-visualization, mobile-dev
- Issue type
- Feature
- Difficulty
- 3/5
- Estimated time
- 1-2 days
- Activity status
- Stale
- Clarity
- Mostly clear
- Newbie friendliness
- 25/100