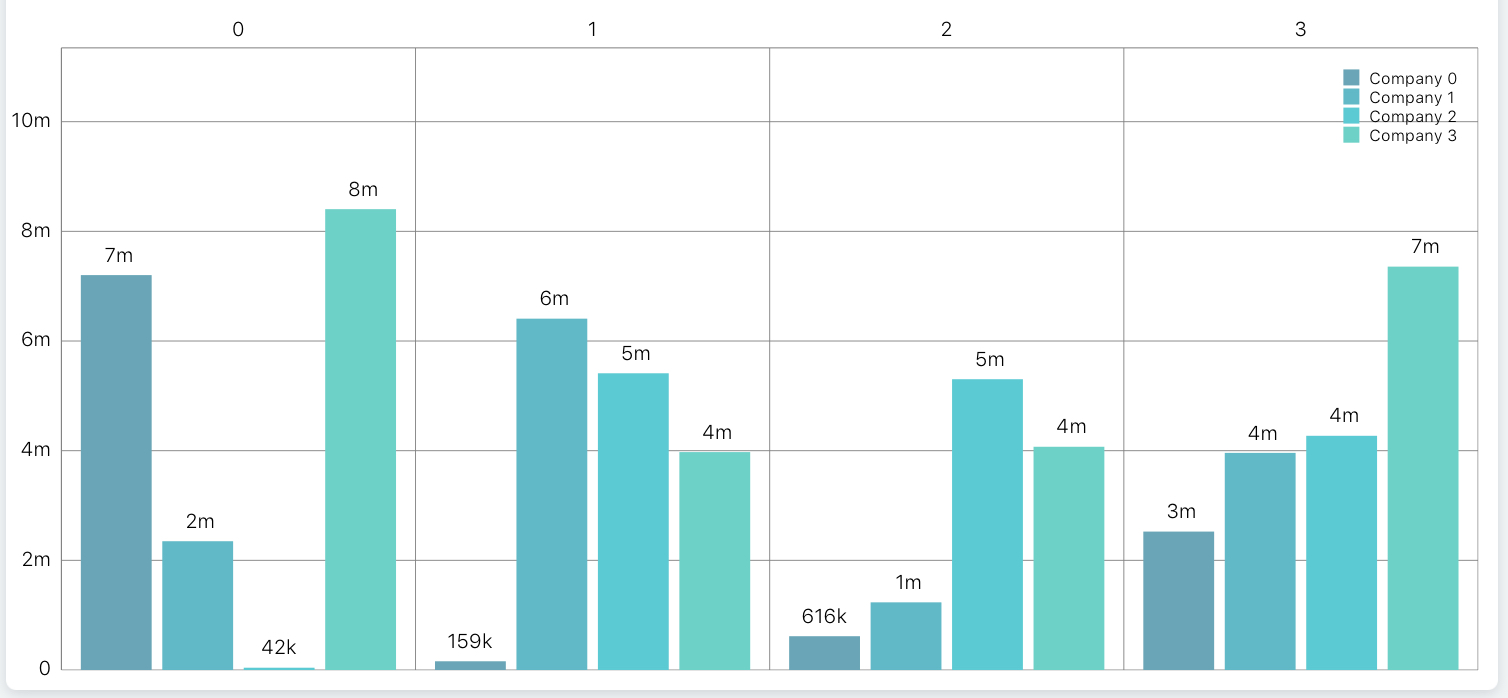
Multiple Bar chart with different number of bars in each set
- Dominant language
- Swift
- Stars
- 28k
- Forks
- 6k
- PR merge metrics
- No merged PRs in 30d
Description
## What did you do?
I have created my data set as follows.
Block:
```
let block: (Int) -> BarChartDataEntry = { (i) -> BarChartDataEntry in
return BarChartDataEntry(x: Double(i), y: Double(arc4random_uniform(randomMultiplier)))
}
```
For Loop
```
startYear = 0
endYear = 5
for i in 0..<4 {
let yVals = (startYear ..< endYear).map(block)
let set = BarChartDataSet(entries: yVals, label: "Company \(i)")
colorIndex = colorIndex < colors.count ? colorIndex : 0
set.setColor(colors[colorIndex])
colorIndex += 1
dataSetList.append(set)
}
```
## What did you expect to happen?
4 set's with 5 bar's in each set.
## What happened instead?
Chart draws only 4 set's with 4 bar's in each set
## Charts Environment
**Charts version/Branch/Commit Number:**
**Xcode version:** 10.2
**Swift version:** 5.0
**Platform(s) running Charts:** iPad - v11.3.1
**macOS version running Xcode:** 10.14.6
Contributor guide
Research direction
No source file or test is named. Reproduce the supplied Swift data-generation loops with Charts using the listed Xcode, Swift, and iPad environment, then compare the generated dataset counts with the rendered bar groups. Done means determining whether the discrepancy is in the reported input or Charts rendering and identifying the relevant regression coverage.
Written by the indexing model from the issue text.
Assessment
- Tech stack
- swift
- Domain
- mobile-dev
- Issue type
- Bug
- Difficulty
- 3/5
- Estimated time
- 1-2 days
- Activity status
- Stale
- Clarity
- Needs clarification
- Newbie friendliness
- 25/100