Dashed Line Not Working Properly
- Dominant language
- Swift
- Stars
- 28k
- Forks
- 6k
- PR merge metrics
- No merged PRs in 30d
Description
* [x] I've read, understood, and done my best to follow the [*CONTRIBUTING guidelines](https://github.com/jjatie/Charts/blob/master/CONTRIBUTING.md).
## What did you do?
Plotting a dashed line in a line chart not working properly. See image:
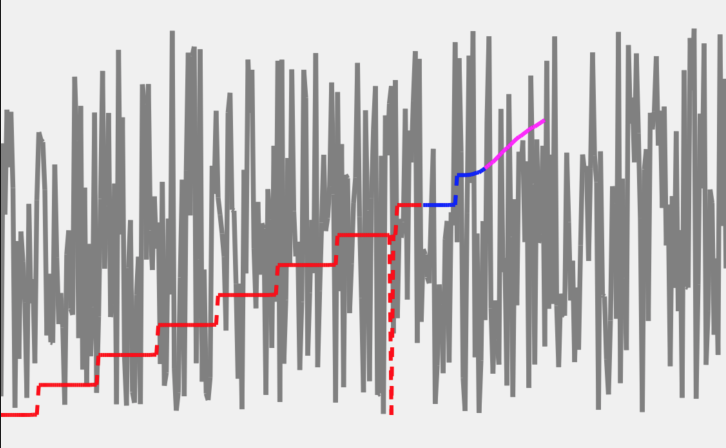
There are 365 points per data set. Those that are close to each other don't reflect the dashed line. as you can see on the red line, I intentionally dropped one of the points to have a Y of zero so that it will show the dashed line. The blue and pink line don't appear dashed.
## What did you expect to happen?
Dashed line should reflect
## What happened instead?
See above
## Charts Environment
**Charts version/Branch/Commit Number:**
3.3.0
**Xcode version:**
10.2.1
**Swift version:**
5.0
**Platform(s) running Charts:**
iPhone
**macOS version running Xcode:**
10.14.6
## Demo Project
[Archive.zip](https://github.com/danielgindi/Charts/files/3532935/Archive.zip)
I did it on the ChartsiOS Demo version. Please see MultipleLinesChartViewController.swift
Contributor guide
Research direction
Start with MultipleLinesChartViewController.swift in the linked demo project and reproduce the dashed-line case using the provided archive and the reported Charts 3.3.0 environment. Compare lines whose points are close together with the red line containing a zero value; done means dashed styling is visibly preserved for all plotted lines.
Written by the indexing model from the issue text.
Assessment
- Tech stack
- ios, swift
- Domain
- data-visualization, mobile-dev
- Issue type
- Bug
- Difficulty
- 3/5
- Estimated time
- 1-2 days
- Activity status
- Stale
- Clarity
- Mostly clear
- Newbie friendliness
- 35/100