Multiple Y-Axis Support
- Dominant language
- Swift
- Stars
- 28k
- Forks
- 6k
- PR merge metrics
- No merged PRs in 30d
Description
* [x] I've read, understood, and done my best to follow the [*CONTRIBUTING guidelines](https://github.com/jjatie/Charts/blob/master/CONTRIBUTING.md).
## What did you do?
Searched on Opened and Closed issues in Github as well as Stackoverflow for answers.
I have 3 data sets in my LineChartView. The range of these data sets can be extreme. Example: Data set 1 has a range of 1000 - 5000, data Set 2 has a range of 50-100, and data set 3 has a range of 0.0001 - 0.00009. If I graph them and put data set 1 on left axis
## What did you expect to happen?
I want a different Y-Axis for each data sets so that graphs with huge range difference can still be viewed properly.
## What happened instead?
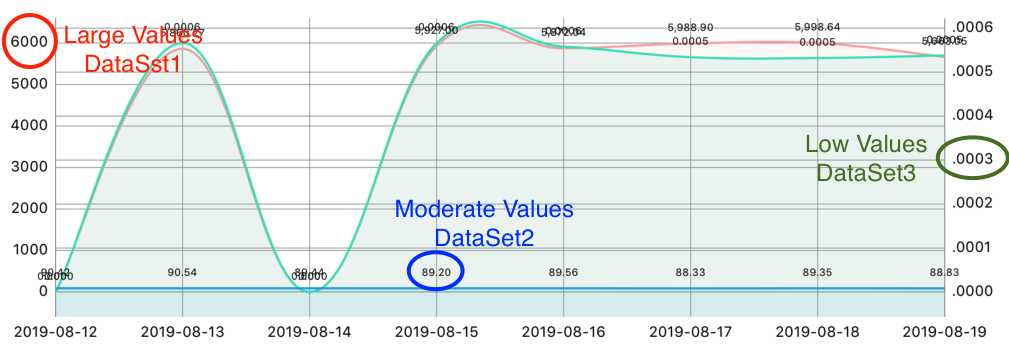
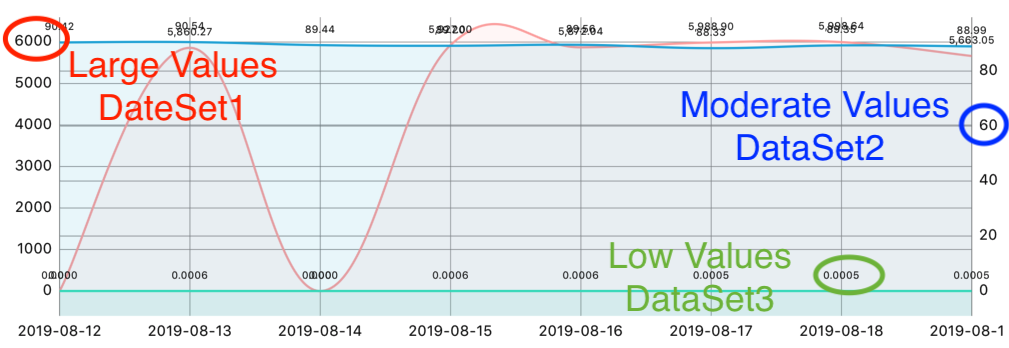
I have 3 data sets in my LineChartView. The difference in the range of these data sets can be extreme. Example: DataSet1 has a range of 1000 - 5000, DataSet2 has a range of 70-90, and DataSet3 has a range of 0.0001 - 0.00009. If I graph them and put DataSet1 on left axis, DataSet2 and DataSet3 on right axis, the DataSet3 graph appeared to be just a flat line because of its very low range compared to DataSet2. If I move data set 2 on right axis, it will also appear almost a flat line because they have a very huge range difference against DataSet1.
## Charts Environment
**Charts version/Branch/Commit Number:** Version 3.3.0
**Xcode version:** 10.3
**Swift version:** 5.0
**Platform(s) running Charts:** iPhone 8 plus on iOS 12
**macOS version running Xcode:** macOS Mojave v. 10.14.6
## Demo Project
I have a screenshot of what happens.
First image is when DataSet1 and DataSet2 are both on left axis and DataSet3 in on Right axis.
Second image is when I moved DataSet2 on right axis along with DataSet3.
Contributor guide
Research direction
No source files or tests are named. Start by locating LineChartView and the existing left/right axis assignment and scaling behavior for datasets. Done means datasets with widely different ranges can each use an independent Y-axis and remain readable, with coverage for the reported three-dataset case.
Written by the indexing model from the issue text.
Assessment
- Tech stack
- swift
- Domain
- data-visualization, mobile
- Issue type
- Feature
- Difficulty
- 5/5
- Estimated time
- Over a week
- Activity status
- Stale
- Clarity
- Needs clarification
- Newbie friendliness
- 25/100