The grid line space of Y-axis will be narrowed after showing a bar
- Dominant language
- Swift
- Stars
- 28k
- Forks
- 6k
- PR merge metrics
- No merged PRs in 30d
Description
## What did you do?
Create a BarChart with 5 line labels and grid lines on Y-axis from 0 to 100
## What did you expect to happen?
The height of Y-axis should be always same before and after showing a bar on chart
## What happened instead?
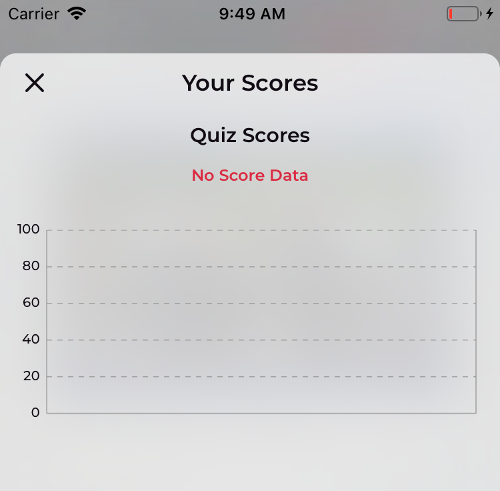
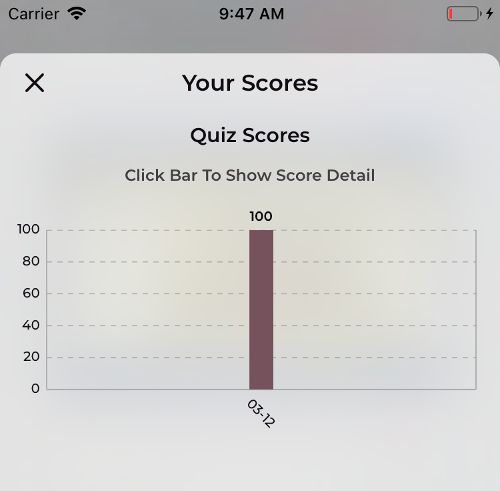
The height of Y-axis is changed after showing a bar on chart, which means the grid lines space on Y-axis is narrowed with bar showing animation
## Charts Environment
Charts version/Branch/Commit Number: latest
Swift version: 4
Platform(s) running Charts: ios 12
macOS version running Xcode: mojave
Compare the below pics, the grid line space in the second picture will be smaller than the first one.
## Demo Project
Here is my code snippet:
1. setup chartView (using autolayout)
```swift
quizChartView = BarChartView().untranslateAutosizing()
quizChartView.heightAnchor >= 200
```
2. setup y-axis for chartView:
```swift
let leftAxis = chartView.leftAxis
leftAxis.labelFont = theme.primaryFont(10)!
leftAxis.labelTextColor = theme.primaryFGColor
leftAxis.axisMinimum = 0
leftAxis.axisMaximum = 100
leftAxis.drawAxisLineEnabled = true
leftAxis.drawGridLinesEnabled = true
leftAxis.drawTopYLabelEntryEnabled = true
leftAxis.drawBottomYLabelEntryEnabled = true
leftAxis.labelPosition = .outsideChart
leftAxis.labelCount = 5
leftAxis.gridLineDashLengths = [4]
leftAxis.drawZeroLineEnabled = true
leftAxis.zeroLineWidth = 1
leftAxis.zeroLineColor = UIColor.lightGray
```
3. set chart data after showing:
```swift
quizBarChartData = BarChartDataSet(values: [BarChartDataEntry](), label: nil)
quizBarChartData.drawValuesEnabled = true
quizBarChartData.highlightEnabled = true
quizBarChartData.highlightColor = theme.activeFGColor
quizBarChartData.highlightAlpha = 1
quizBarChartData.setColor(theme.userPerformance.quizColor)
let quizData = BarChartData(dataSet: quizBarChartData)
quizData.setValueFont(theme.primaryBoldFont(10)!)
quizData.setValueFormatter(ScoreAxisValueFormatter())
quizChartView.data = quizData
let (quizValues, quizData) = buildBarChartData(quizDataSource)
quizBarChartData.values = quizData
quizChartView.xAxis.valueFormatter = IndexAxisValueFormatter(values: quizValues)
quizChartView.fitScreen()
quizChartView.data?.notifyDataChanged()
quizChartView.notifyDataSetChanged()
```
Contributor guide
Assessment
This issue has not been assessed yet.