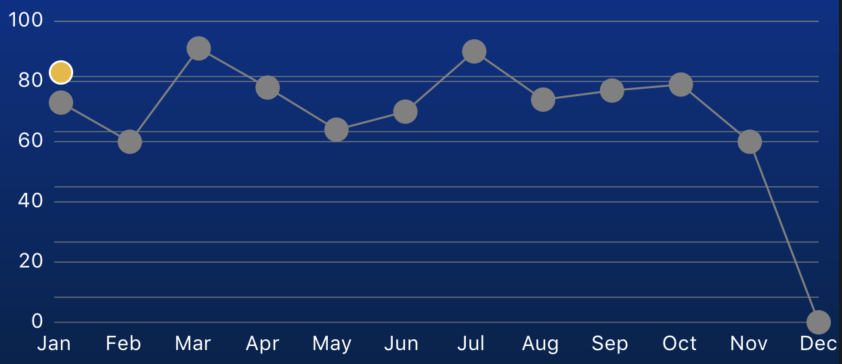
Dual Y axis lines in grid section of Chart
- Dominant language
- Swift
- Stars
- 28k
- Forks
- 6k
- PR merge metrics
- No merged PRs in 30d
Description
> ℹ Please fill out this template when filing an issue.
> All lines beginning with an ℹ symbol instruct you with what info we expect. You can delete those lines once you've filled in the info.
>
> Per our [*CONTRIBUTING guidelines](https://github.com/jjatie/Charts/blob/master/CONTRIBUTING.md), we use GitHub for
> bugs and feature requests, not general support. Other issues should be opened on Stack Overflow with the tag [`ios-charts`.](https://stackoverflow.com/questions/tagged/ios-charts)
>
> Please remove this line and everything above it before submitting.
* [ ] I've read, understood, and done my best to follow the [*CONTRIBUTING guidelines](https://github.com/jjatie/Charts/blob/master/CONTRIBUTING.md).
## What did you do?
Provided data to chart for drawing the graph
## What did you expect to happen?
Unique lines of set of two data.
## What happened instead?
Redundant lines in Y axis.
## Charts Environment
**Charts version/Branch/Commit Number:
**Xcode version:**
**Swift version:**
**Platform(s) running Charts:**
**macOS version running Xcode:**
## Demo Project
Contributor guide
Research direction
Start by reproducing the reported dual-Y-axis chart behavior in the Charts repository using the attached screenshot and the issue's data description. Trace the grid and Y-axis rendering entry points, then verify that the chart displays unique lines for the two data sets without redundant Y-axis lines.
Written by the indexing model from the issue text.
Assessment
- Tech stack
- swift
- Domain
- data-visualization, mobile-dev
- Issue type
- Bug
- Difficulty
- 3/5
- Estimated time
- 1-2 days
- Activity status
- Stale
- Clarity
- Needs clarification
- Newbie friendliness
- 25/100