iOS Objective - C BubbleChartView not rendering properly (missing data)
- Dominant language
- Swift
- Stars
- 28k
- Forks
- 6k
- PR merge metrics
- No merged PRs in 30d
Description
## What did you do?
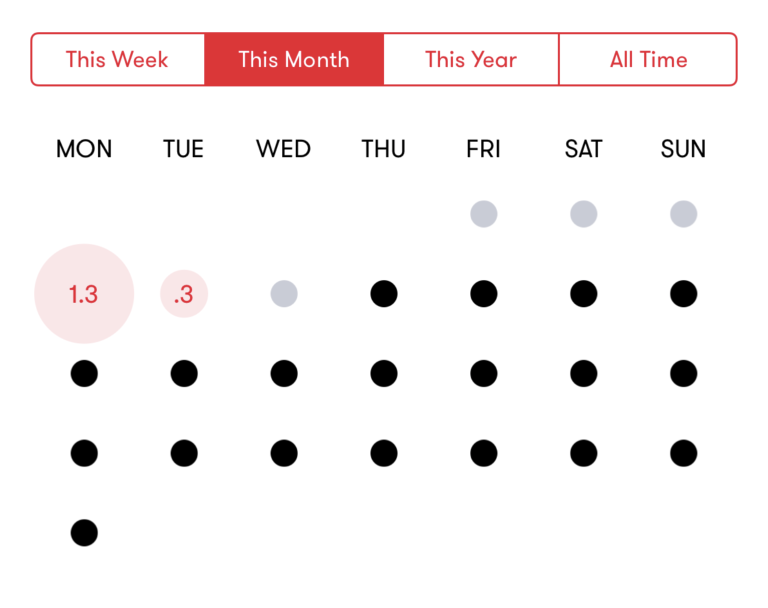
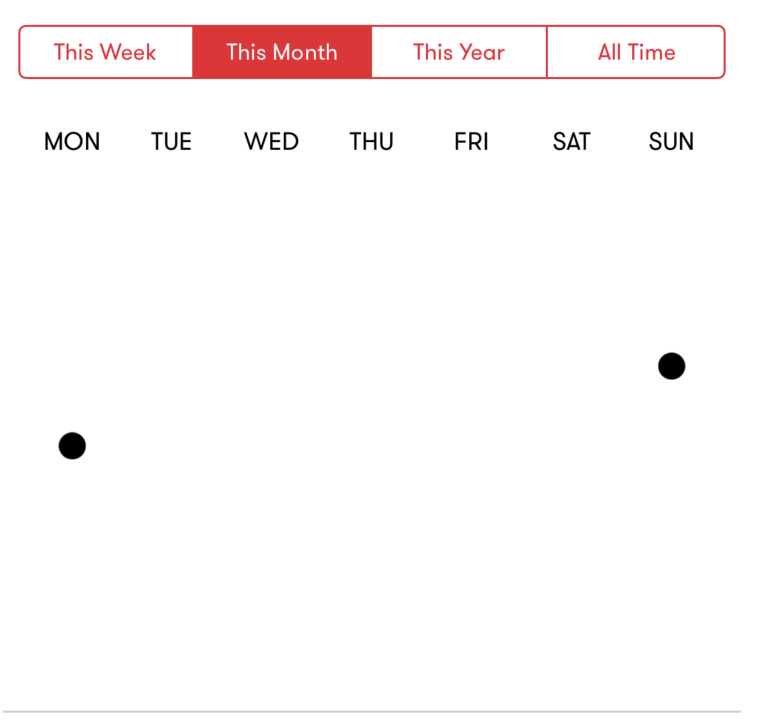
I'm adding a bubble chart in UIScrollView. In some mysterious case, the chart doesn't render correctly, and data is missing.
I'm generating a "calendar" using bubble chart, but instead of presenting dates, I'm presenting some quantifiable data. If there is no data I'm adding images that represent empty days. Everything worked fine, until the start of this month. (Case where there is data from 0 - 5 on the left axis - that is, the days are in 6 different weeks).
I've checked my logic for generating the BubbleChartDataEntries, BubbleChartDataSet and BubbleChartData but everything seems fine.
Code for init of view:
`
self.bubbleChartView = [BubbleChartView new];
[self.bubbleChartView.xAxis setLabelPosition:XAxisLabelPositionTop];
[self.bubbleChartView.xAxis setLabelFont:[Fonts fontGTWalsheimProRegularWithSize:13]];
self.bubbleChartView.userInteractionEnabled = NO;
[self.bubbleChartView setDrawBordersEnabled:NO];
[self.bubbleChartView setDrawGridBackgroundEnabled:NO];
[self.bubbleChartView.leftAxis setDrawLabelsEnabled:NO];
[self.bubbleChartView.leftAxis setDrawZeroLineEnabled:NO];
[self.bubbleChartView.leftAxis setDrawAxisLineEnabled:NO];
[self.bubbleChartView.leftAxis setDrawGridLinesEnabled:NO];
[self.bubbleChartView.leftAxis setDrawLabelsEnabled:NO];
self.bubbleChartView.chartDescription.text = @"";
[self.bubbleChartView.legend setEnabled:NO];
[self.bubbleChartView.rightAxis setEnabled:NO];
[self.bubbleChartView.xAxis setDrawGridLinesEnabled:NO];
[self.bubbleChartView.xAxis setDrawAxisLineEnabled:NO];
[self.bubbleChartView.xAxis setAxisMinimum:-0.5];
[self.bubbleChartView.xAxis setAxisMaximum:6.5];
[self.bubbleChartView.leftAxis setAxisMinimum:-0.5];
[self.bubbleChartView setMaxVisibleCount:999];
[self.bubbleChartView setContentScaleFactor:0.5];
`
Code for generating data:
`
NSDate *today = [NSDate new];
NSCalendar *calendar = [NSCalendar currentCalendar];
NSInteger day = [calendar component:NSCalendarUnitDay fromDate:today];
BubbleChartData *bubbleChartData;
BubbleChartDataSet *bubbleChartDataSet = [BubbleChartDataSet new];
int numberOfWeek = self.dataSourceThisMonth.count - 1;
for (NSMutableArray *tmpWeekArray in self.dataSourceThisMonth) {
int index;
if (numberOfWeek == self.dataSourceThisMonth.count - 1) {
index = 7 - tmpWeekArray.count;
} else {
index = 0;
}
for (NSDictionary *tmpDict in tmpWeekArray) {
BubbleChartDataEntry *tmpEntry;
if ([tmpDict[@"distance"] isEqualToString:@"0.0"]) {
if ([tmpDict[@"day"] integerValue] <= day) {
tmpEntry = [[BubbleChartDataEntry alloc] initWithX:index y:numberOfWeek size:0.0 icon:[Theme currentTheme].chartMonthDotPast];
} else {
tmpEntry = [[BubbleChartDataEntry alloc] initWithX:index y:numberOfWeek size:0.0 icon:[Theme currentTheme].chartMonthDotFuture];
}
} else {
tmpEntry = [[BubbleChartDataEntry alloc] initWithX:index y:numberOfWeek size:[[ImperialMeasurementsManager sharedManager] distanceWithCurrentUnitFromValue: [tmpDict[@"distance"] floatValue]] icon:[UIImage imageFromColor:[UIColor clearColor] size:CGSizeMake(42, 42)]];
}
[bubbleChartDataSet addEntry:tmpEntry];
index += 1;
}
numberOfWeek -= 1;
}
[bubbleChartDataSet setColor:[Theme currentTheme].bubbleChartValueColor];
[bubbleChartDataSet setDrawValuesEnabled:YES];
[bubbleChartDataSet setDrawIconsEnabled:YES];
[bubbleChartDataSet setValueTextColor:[Theme currentTheme].highlightColor];
bubbleChartData = [[BubbleChartData alloc] initWithDataSet:bubbleChartDataSet];
[bubbleChartData setValueFont:[Fonts fontGTWalsheimProRegularWithSize:13]];
[bubbleChartData setValueFormatter:[[ChartDefaultValueFormatter alloc] initWithDecimals:1]];
[mainView.chartsThisMonthView.bubbleChartView setData:bubbleChartData];
[mainView.chartsThisMonthView.bubbleChartView.xAxis setValueFormatter:[[ChartIndexAxisValueFormatter alloc] initWithValues:self.daysOfWeek]];
[mainView.chartsThisMonthView.bubbleChartView.leftAxis setAxisMaximum:self.dataSourceThisMonth.count - 0.5];
[mainView.chartsThisMonthView.bubbleChartView notifyDataSetChanged];
`
Generated data set:
`
po bubbleChartDataSet
Charts.BubbleChartDataSet, label: DataSet, 31 entries:
ChartDataEntry, x: 5.0, y 5.0
ChartDataEntry, x: 6.0, y 5.0
ChartDataEntry, x: 0.0, y 4.0
ChartDataEntry, x: 1.0, y 4.0
ChartDataEntry, x: 2.0, y 4.0
ChartDataEntry, x: 3.0, y 4.0
ChartDataEntry, x: 4.0, y 4.0
ChartDataEntry, x: 5.0, y 4.0
ChartDataEntry, x: 6.0, y 4.0
ChartDataEntry, x: 0.0, y 3.0
ChartDataEntry, x: 1.0, y 3.0
ChartDataEntry, x: 2.0, y 3.0
ChartDataEntry, x: 3.0, y 3.0
ChartDataEntry, x: 4.0, y 3.0
ChartDataEntry, x: 5.0, y 3.0
ChartDataEntry, x: 6.0, y 3.0
ChartDataEntry, x: 0.0, y 2.0
ChartDataEntry, x: 1.0, y 2.0
ChartDataEntry, x: 2.0, y 2.0
ChartDataEntry, x: 3.0, y 2.0
ChartDataEntry, x: 4.0, y 2.0
ChartDataEntry, x: 5.0, y 2.0
ChartDataEntry, x: 6.0, y 2.0
ChartDataEntry, x: 0.0, y 1.0
ChartDataEntry, x: 1.0, y 1.0
ChartDataEntry, x: 2.0, y 1.0
ChartDataEntry, x: 3.0, y 1.0
ChartDataEntry, x: 4.0, y 1.0
ChartDataEntry, x: 5.0, y 1.0
ChartDataEntry, x: 6.0, y 1.0
ChartDataEntry, x: 0.0, y 0.0
`
self.dataSourceThisMonth (Server data):
`
<__NSArrayM 0x600000343420>(
<__NSArrayM 0x600000341500>(
{
day = 1;
distance = "0.0";
},
{
day = 2;
distance = "0.0";
}
)
,
<__NSArrayM 0x600000343270>(
{
day = 3;
distance = "1.3";
},
{
day = 4;
distance = "0.3";
},
{
day = 5;
distance = "0.0";
},
{
day = 6;
distance = "0.0";
},
{
day = 7;
distance = "0.0";
},
{
day = 8;
distance = "0.0";
},
{
day = 9;
distance = "0.0";
}
)
,
<__NSArrayM 0x600000342df0>(
{
day = 10;
distance = "0.0";
},
{
day = 11;
distance = "0.0";
},
{
day = 12;
distance = "0.0";
},
{
day = 13;
distance = "0.0";
},
{
day = 14;
distance = "0.0";
},
{
day = 15;
distance = "0.0";
},
{
day = 16;
distance = "0.0";
}
)
,
<__NSArrayM 0x600000342640>(
{
day = 17;
distance = "0.0";
},
{
day = 18;
distance = "0.0";
},
{
day = 19;
distance = "0.0";
},
{
day = 20;
distance = "0.0";
},
{
day = 21;
distance = "0.0";
},
{
day = 22;
distance = "0.0";
},
{
day = 23;
distance = "0.0";
}
)
,
<__NSArrayM 0x6000003420d0>(
{
day = 24;
distance = "0.0";
},
{
day = 25;
distance = "0.0";
},
{
day = 26;
distance = "0.0";
},
{
day = 27;
distance = "0.0";
},
{
day = 28;
distance = "0.0";
},
{
day = 29;
distance = "0.0";
},
{
day = 30;
distance = "0.0";
}
)
,
<__NSArrayM 0x600000341860>(
{
day = 31;
distance = "0.0";
}
)
)
`
## What did you expect to happen?
Something similar to this screenshot:
## What happened instead?
This:
## Charts Environment
**Charts version/Branch/Commit Number:** first 3.1.1, then updated to 3.2.1
**Xcode version:** 10.1
**Swift version:** 4.0
**Platform(s) running Charts:** iOS 10 / 11 / 12
**macOS version running Xcode:** macOS Mojave 10.14.1
Contributor guide
Research direction
Start by reproducing the issue with BubbleChartView using the posted BubbleChartDataSet and the axis configuration, especially the six-week case. Inspect how BubbleChartView renders entries with zero-size icons and the configured axis bounds. Done means all calendar entries render in the expected positions with no missing data on the supported iOS versions.
Written by the indexing model from the issue text.
Assessment
- Tech stack
- ios, objective-c, swift
- Domain
- data-visualization, mobile
- Issue type
- Bug
- Difficulty
- 4/5
- Estimated time
- 3-5 days
- Activity status
- Stale
- Clarity
- Needs clarification
- Newbie friendliness
- 28/100