very lag and not smooth when drag and zoom the lineChartView
- Dominant language
- Swift
- Stars
- 28k
- Forks
- 6k
- PR merge metrics
- No merged PRs in 30d
Description
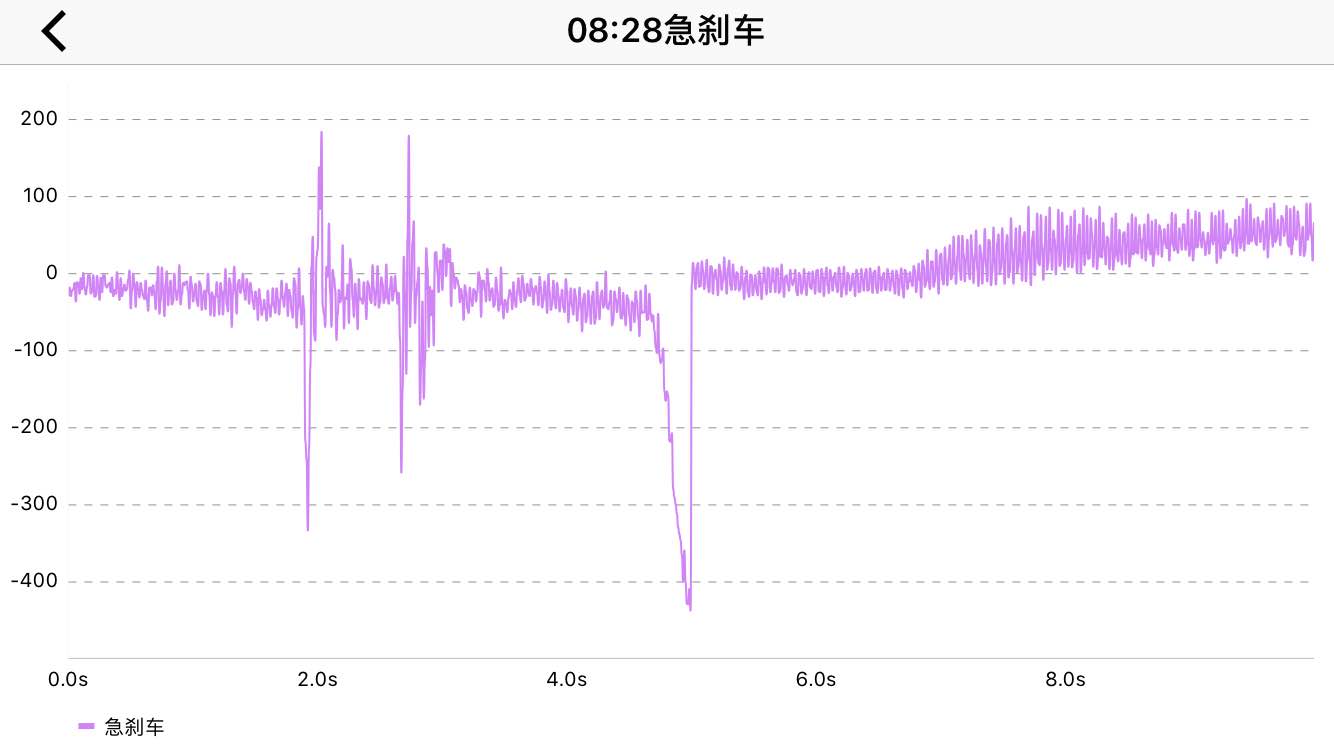
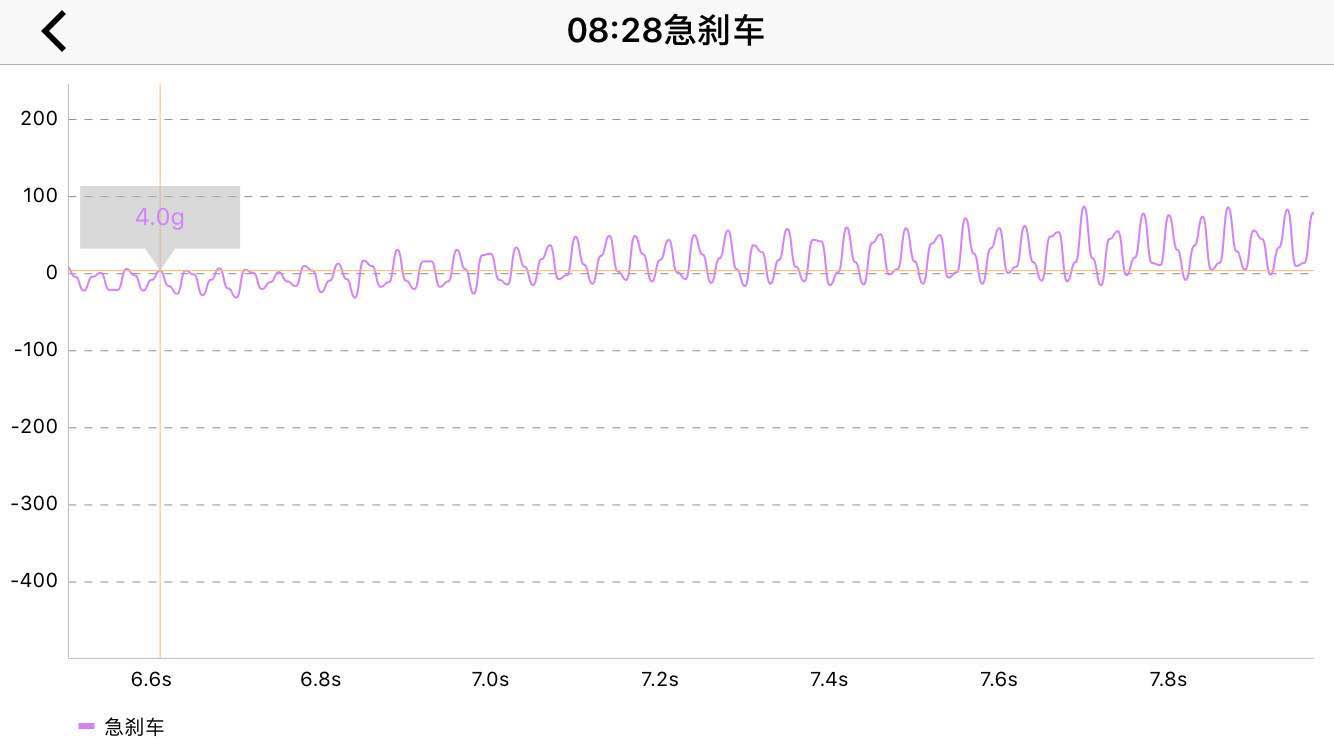
very lag and not smooth when drag and zoom the lineChartView,the same is true for the first load, and when i drag to some scale(like the last pic), It's become to normal with temporary。
**there are my code**
`
private func fetchEventChartInfo() {
guard let id = self.event?.eventId else {return}
showProgressHUD()
RainHttpManager.request(ApiTrip.fetchTripEventChartInfo(eventId: id), success: { (response) in
let details = response?["details"].arrayValue
self.configureChartView(details: details)
}) { (errCode, errMsg, response) in
self.showErrorHUD(errMsg)
}
}
private func initChartView() {
chartView.chartDescription?.enabled = false
chartView.dragEnabled = true
chartView.pinchZoomEnabled = true
chartView.scaleYEnabled = false
chartView.xAxis.gridColor = UIColor.white
chartView.leftAxis.gridLineDashLengths = [4, 4]
chartView.leftAxis.gridColor = UIColor.color(withHex: "909090")
chartView.rightAxis.enabled = false
chartView.xAxis.labelPosition = .bottom
chartView.xAxis.axisLineColor = UIColor.color(withHex: "BBBBBB")
chartView.leftAxis.axisLineColor = UIColor.color(withHex: "BBBBBB")
chartView.xAxis.labelCount = 10
chartView.xAxis.valueFormatter = SecondAxisValueFormatter()
let marker = BalloonMarker(color: UIColor(white: 180/255, alpha: 0.5),
font: .systemFont(ofSize: 12),
textColor: TripBehavior(rawValue: event!.type)?.chartColor() ?? UIColor.red,
insets: UIEdgeInsets(top: 8, left: 8, bottom: 20, right: 8))
marker.type = TripBehavior(rawValue: event!.type)
marker.chartView = chartView
marker.minimumSize = CGSize(width: 80, height: 40)
chartView.marker = marker
chartView.legend.form = .line
chartView.animate(xAxisDuration: 2.5)
}
private func configureChartView(details: [JSON]?) {
guard let details = details else {return}
guard let event = self.event else {return}
var values = [Float]()
if event.type == TripBehavior.speedDown.rawValue || event.type == TripBehavior.speedUp.rawValue {
values = details.map {$0["ax"].floatValue}
} else if event.type == TripBehavior.hurryTurn.rawValue {
values = details.map{$0["gz"].floatValue}
}
guard values.count > 0 else {return}
let chartValues = (0.. ChartDataEntry in
return ChartDataEntry.init(x: Double(i)/100, y: Double(values[i]))
}
let set1 = LineChartDataSet(values: chartValues, label: event.des)
set1.drawIconsEnabled = false
set1.lineDashLengths = [1, 0]
set1.highlightLineDashLengths = [1, 0]
set1.setColor(TripBehavior(rawValue: event.type)?.chartColor() ?? UIColor.red)
set1.lineWidth = 1
set1.circleRadius = 0
set1.drawCircleHoleEnabled = false
set1.valueTextColor = UIColor.clear
set1.drawFilledEnabled = false
set1.mode = .horizontalBezier
let data = LineChartData(dataSet: set1)
chartView.data = data
}
`
Contributor guide
Assessment
This issue has not been assessed yet.