Animate limit lines on adds to graph
Open
feature
- Dominant language
- Swift
- Stars
- 28k
- Forks
- 6k
- PR merge metrics
- No merged PRs in 30d
Description
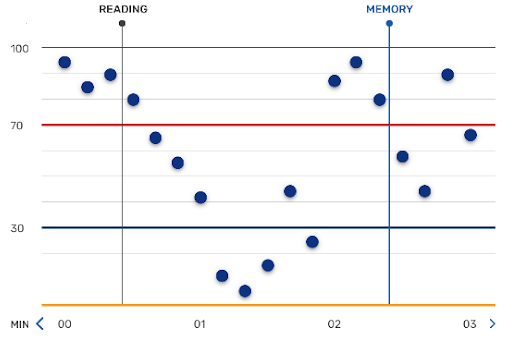
Is there is a way to add limit line to the chart with animation (grows from the axis to end of chart view)?
I am trying to add limit line dynamically to the chart and make it also with some easing animation.
Here the example of my chart I have to do:
Contributor guide
Assessment
This issue has not been assessed yet.