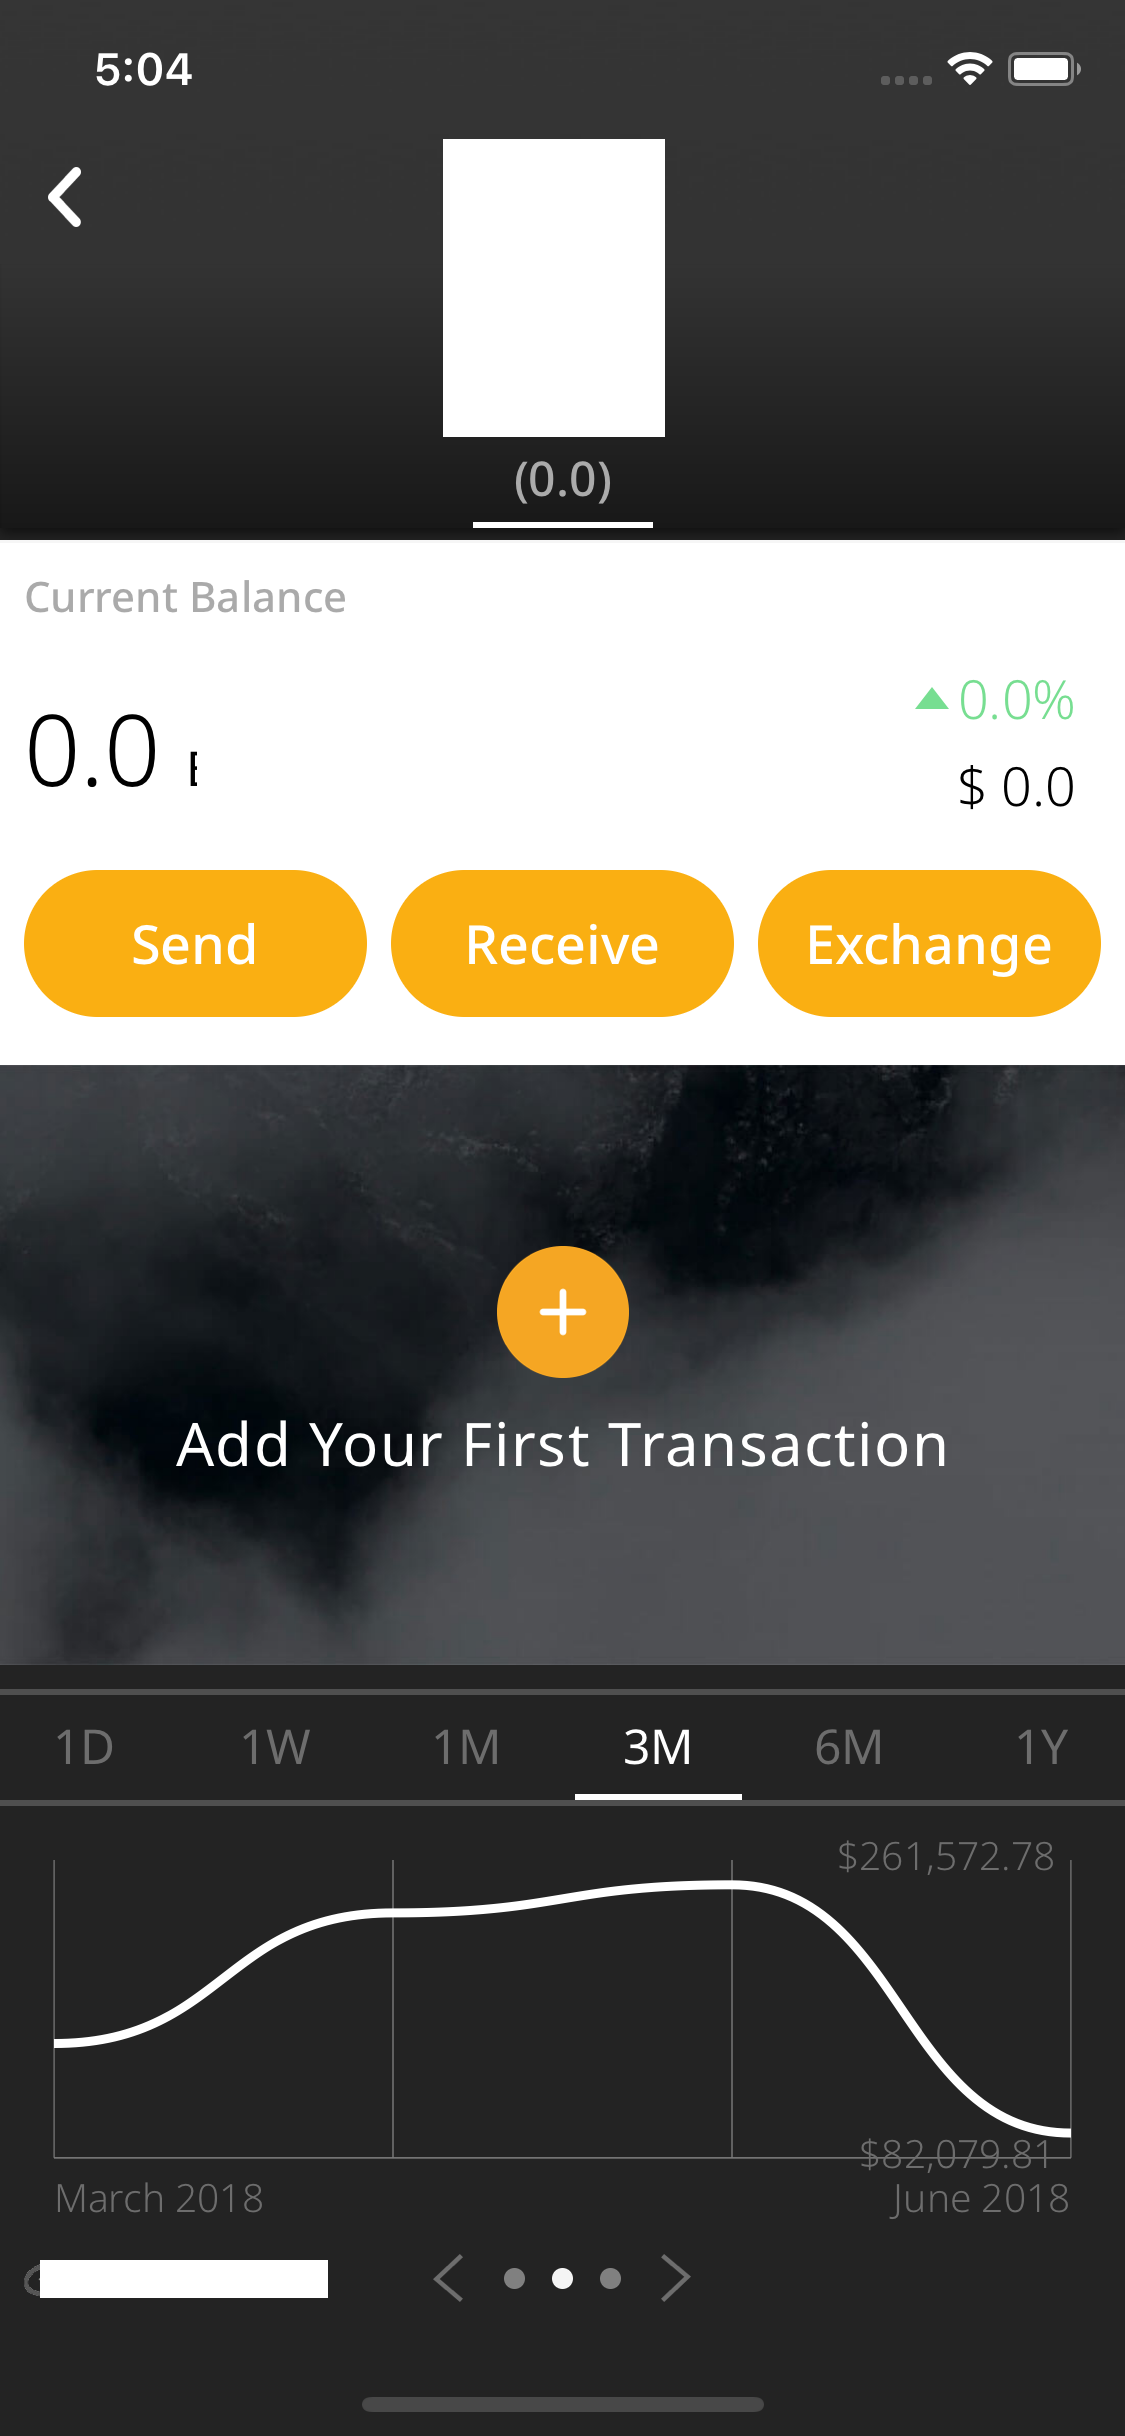
Need to show Min and Max value at rightAxis but it will display outside of chart. Help Needed
- Dominant language
- Swift
- Stars
- 28k
- Forks
- 6k
- PR merge metrics
- No merged PRs in 30d
Description
## What did You do?
I have to show only min and max value at xAxis but when i implement this with below code the value display outside the chart or on the yAxis line. Here is my code of the setup (xAxis)
```
let rightAxis = chartView.rightAxis
rightAxis.drawLimitLinesBehindDataEnabled = true
rightAxis.drawLabelsEnabled = true
rightAxis.drawGridLinesEnabled = false
rightAxis.gridColor = UIColor.clear
rightAxis.labelFont = Font.init(Font.FontType.custom(Font.FontName.NotoSans_Light), size: Font.FontSize.standard(Font.StandardSize.Extra2Small)).instance
rightAxis.labelTextColor = #colorLiteral(red: 0.4274509804, green: 0.4274509804, blue: 0.4274509804, alpha: 1)
rightAxis.enabled = true
rightAxis.drawAxisLineEnabled = false
rightAxis.labelPosition = .insideChart
rightAxis.drawTopYLabelEntryEnabled = true
// leftAxis.drawZeroLineEnabled = true
rightAxis.valueFormatter = CustomValueFormatter()
```
After api calling i get the min and max value which i need to show on the graph i set it like this
```
let rightAxis = chartView.rightAxis
rightAxis.axisMaximum = max
rightAxis.axisMinimum = min
rightAxis.granularity = (max - min) / 2.0
rightAxis.setLabelCount(2, force: true)
```
## What happened instead?
But output will be like this screenshot
**Charts version/Branch/Commit Number:Charts (3.1.1)**
**Xcode version:XCode(9.3)**
**Swift version:Swift 3.0**
**Platform(s) running Charts:Mobile**
**macOS version running Xcode: macOS 10.13.2(high sierra)**
## Demo Project
Just run the project you can reproduce the issue.
[ChartIssue.zip](https://github.com/danielgindi/Charts/files/2089933/ChartIssue.zip)
Contributor guide
Research direction
Start by running the linked ChartIssue.zip demo with Charts 3.1.1 and inspect the rightAxis setup shown in the issue. Reproduce the min/max labels with axisMinimum, axisMaximum, granularity, and setLabelCount, then determine why the labels render outside or on the axis line; done means both values appear inside the chart as intended.
Written by the indexing model from the issue text.
Assessment
- Tech stack
- swift
- Domain
- data-visualization, mobile-dev
- Issue type
- Bug
- Difficulty
- 3/5
- Estimated time
- 1-2 days
- Activity status
- Stale
- Clarity
- Mostly clear
- Newbie friendliness
- 35/100