BarChart displaying more bars than inside the dataset
- Dominant language
- Swift
- Stars
- 28k
- Forks
- 6k
- PR merge metrics
- No merged PRs in 30d
Description
We just migrated from an older charts version and the following strange behaviour occurs.
We are creating the dataset like this:
```
var yVals:[BarChartDataEntry] = []
let statistic = MPStatistic.createStatistic(fromDate, untilDate: untilDate)
var maxCount = 0
if statistic.days.count > 0 {
let dayWithMaxTrainingsPossible = statistic.days.reduce(statistic.days[0]) {
($0.trainingsCountMax > $1.trainingsCountMax) ? $0 : $1
}
maxCount = dayWithMaxTrainingsPossible.trainingsCountMax
}
for (index, day) in statistic.days.enumerated() {
DDLogDebug("\(index) : \(day)")
let entry = BarChartDataEntry(x: Double(index), y: (Double(day.trainingsCountDone) / Double(maxCount) * 100.0))
yVals.append(entry)
}
let barChartDataSet = BarChartDataSet(values: yVals, label: nil)
barChartDataSet.colors = [UIColor.mpGreenColor()]
barChartDataSet.drawValuesEnabled = false
DDLogDebug("DataSetCount stacks: \(barChartDataSet.entryCountStacks) and DataSetCount stack size: \(barChartDataSet.stackSize)")
let barChartData = BarChartData(dataSet: barChartDataSet)
let leftAxis: YAxis = barChartView.leftAxis
leftAxis.labelCount = 5
leftAxis.axisMaximum = Double(100)
leftAxis.axisMinimum = Double(0)
barChartView.xAxis.labelCount = 7
barChartView.data = barChartData
barChartView.notifyDataSetChanged()
```
And we get the following log:
```
2018-01-21 19:23:14:898 app[6838:224957] 0 : MPStatisticDay
2018-01-21 19:23:14:898 app[6838:224957] 1 : MPStatisticDay
2018-01-21 19:23:14:898 app[6838:224957] 2 : MPStatisticDay
2018-01-21 19:23:14:898 app[6838:224957] 3 : MPStatisticDay
2018-01-21 19:23:14:898 app[6838:224957] 4 : MPStatisticDay
2018-01-21 19:23:14:898 app[6838:224957] 5 : MPStatisticDay
2018-01-21 19:23:14:898 app[6838:224957] 6 : MPStatisticDay
2018-01-21 19:23:14:899 app[6838:224957] DataSetCount stacks: 7 and DataSetCount stack size: 1
```
So i assume, there are 7 entries in the data set.
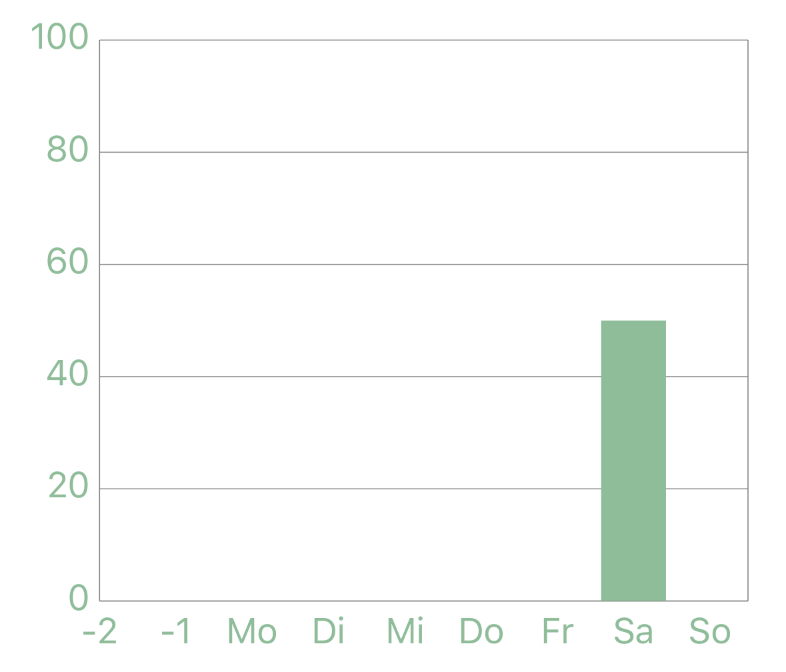
But when we see the chart, there are 9 entries, starting with -1. How is this happening?
We had this before migration: `xAxis.setLabelsToSkip(2)`
but this function is missing now.
The graph looks like this:
Any ideas on this strange thing? thx
Contributor guide
Assessment
This issue has not been assessed yet.