All LineChartDataset values are not plotting
- Dominant language
- Swift
- Stars
- 28k
- Forks
- 6k
- PR merge metrics
- No merged PRs in 30d
Description
HI i'm working in line chart for my app, In this i loaded the
`LineChartDataSet *set1 = [[LineChartDataSet alloc] initWithValues:yValue label:@"Name"];
LineChartData *data = [[LineChartData alloc] initWithDataSet:set1];
self.lineChartView.data = data;`
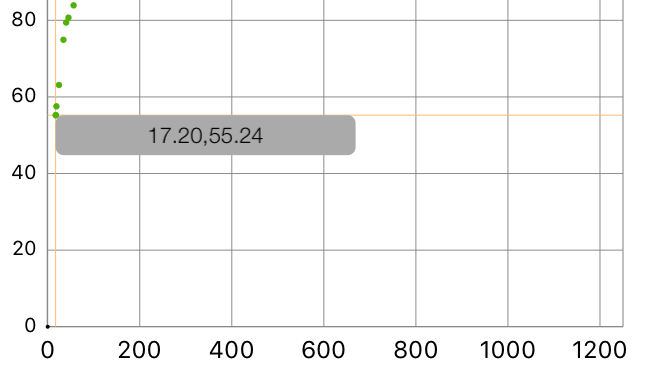
**my yValue are**
entries:
ChartDataEntry, x: _4.16, y 39.77_
ChartDataEntry, x: _15.05, y 48.19_
ChartDataEntry, x: _18.16, y 55.23_
ChartDataEntry, x: **17.2, y 55.24**
ChartDataEntry, x: 19.02, y 57.55
ChartDataEntry, x: 24.55, y 63.12
ChartDataEntry, x: 34.22, y 74.92
ChartDataEntry, x: 40.15, y 79.42
ChartDataEntry, x: 45.17, y 80.7
ChartDataEntry, x: 56.33, y 83.91 ..... for this first three to four values are not plotting
help me..
Contributor guide
Assessment
This issue has not been assessed yet.