LineChartView Fails to Display All Values on X-Axis in TableViewCell
- Dominant language
- Swift
- Stars
- 28k
- Forks
- 6k
- PR merge metrics
- No merged PRs in 30d
Description
I've implemented a line chart within a tableView cell. The left y-axis displays a range of weights and the x-axis displays a range of dates within a month (the right y-axis is disabled). Above the chart is a selector that allows a user to navigate between months. When a different month is selected, the app retrieves the new data for the chosen month and displays that in the line chart.
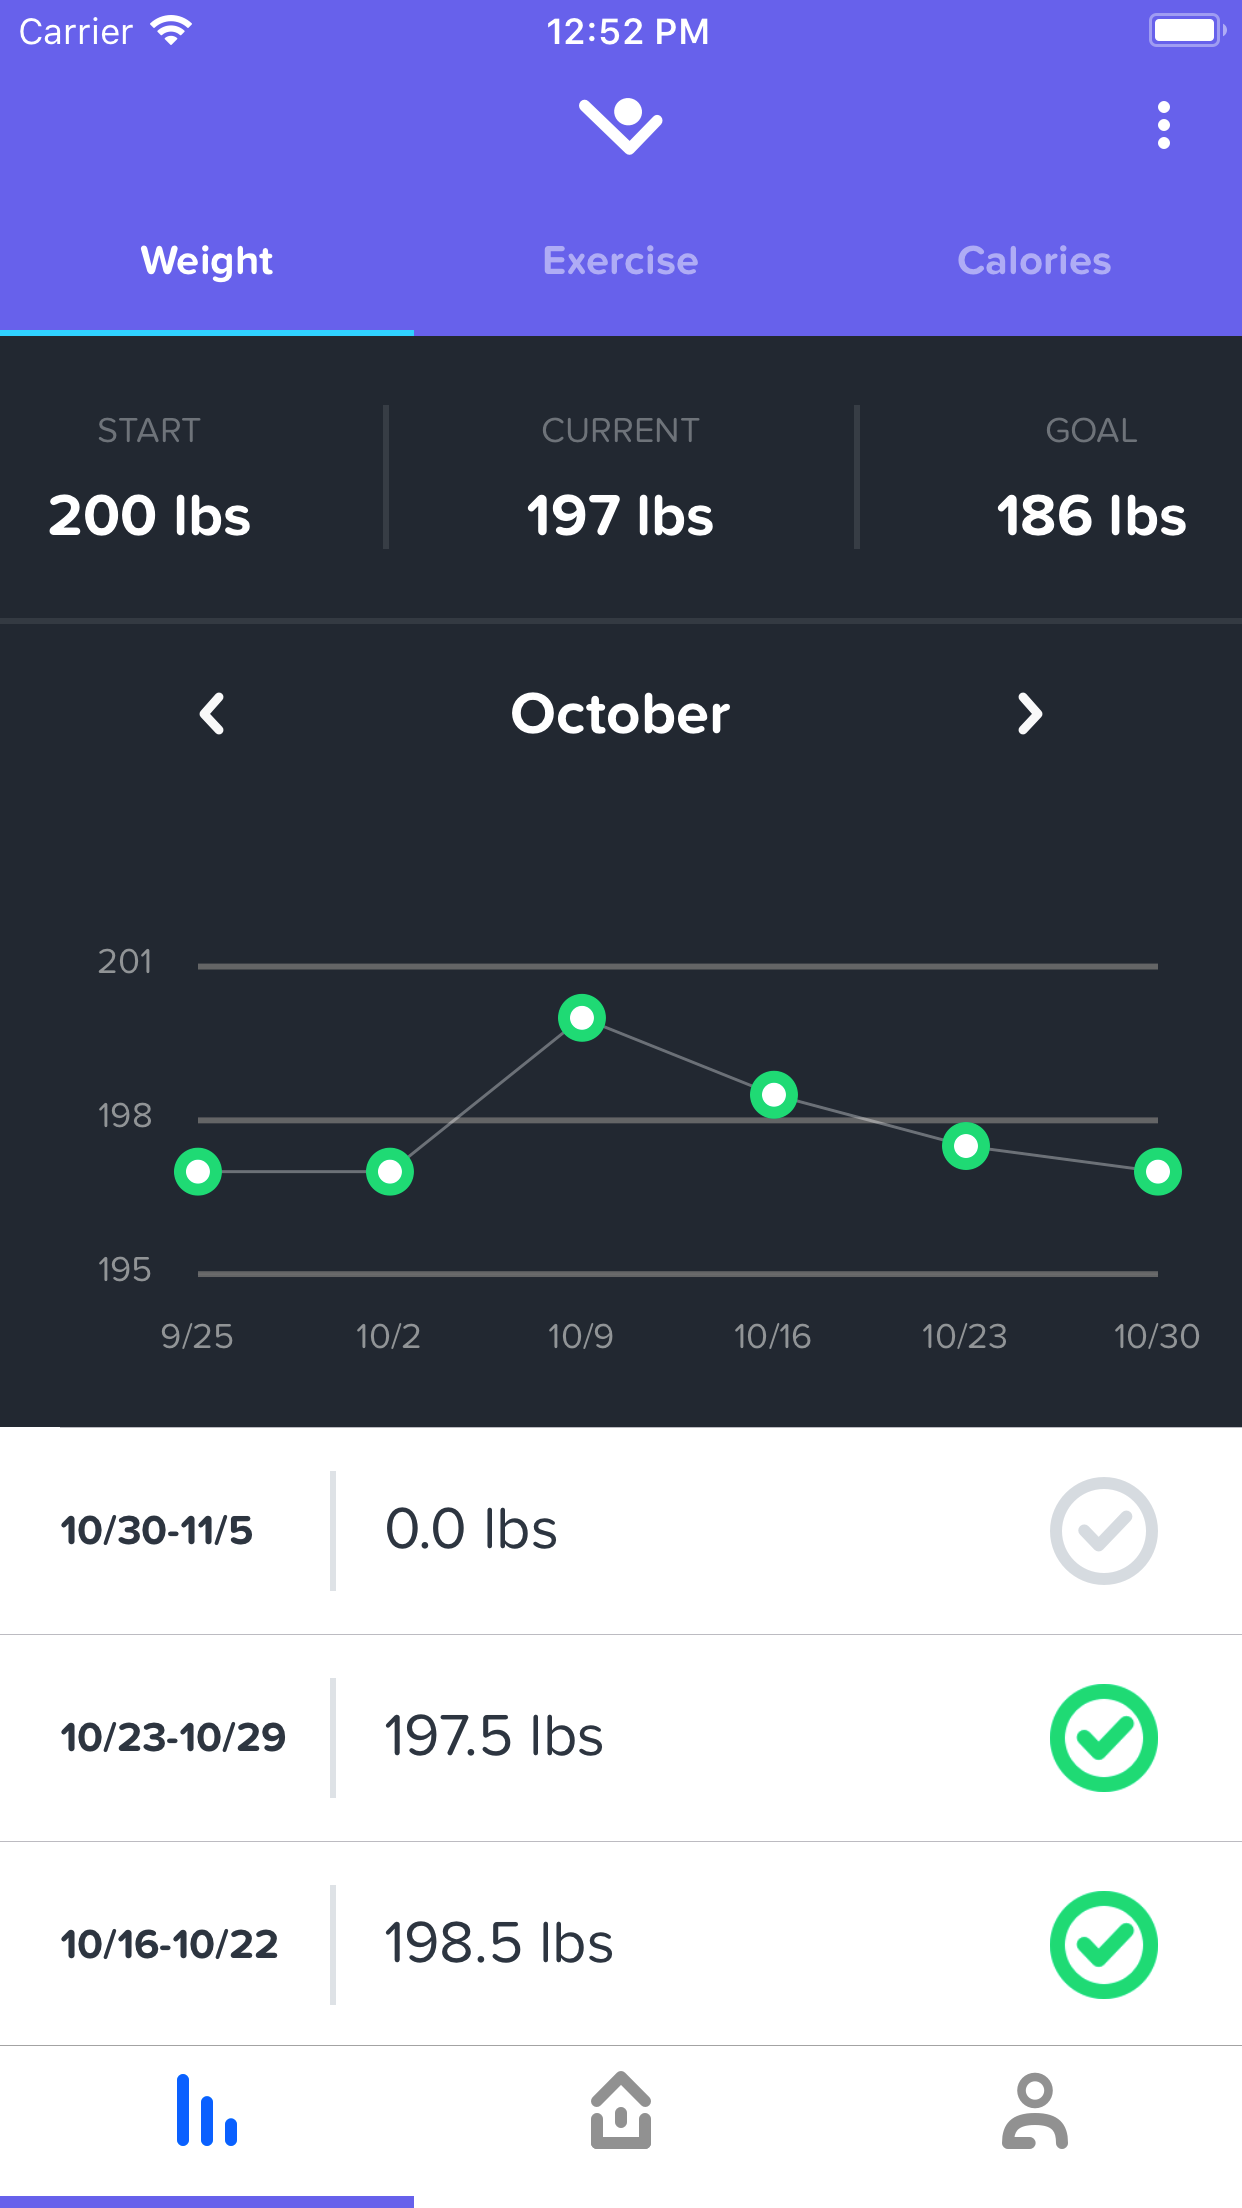
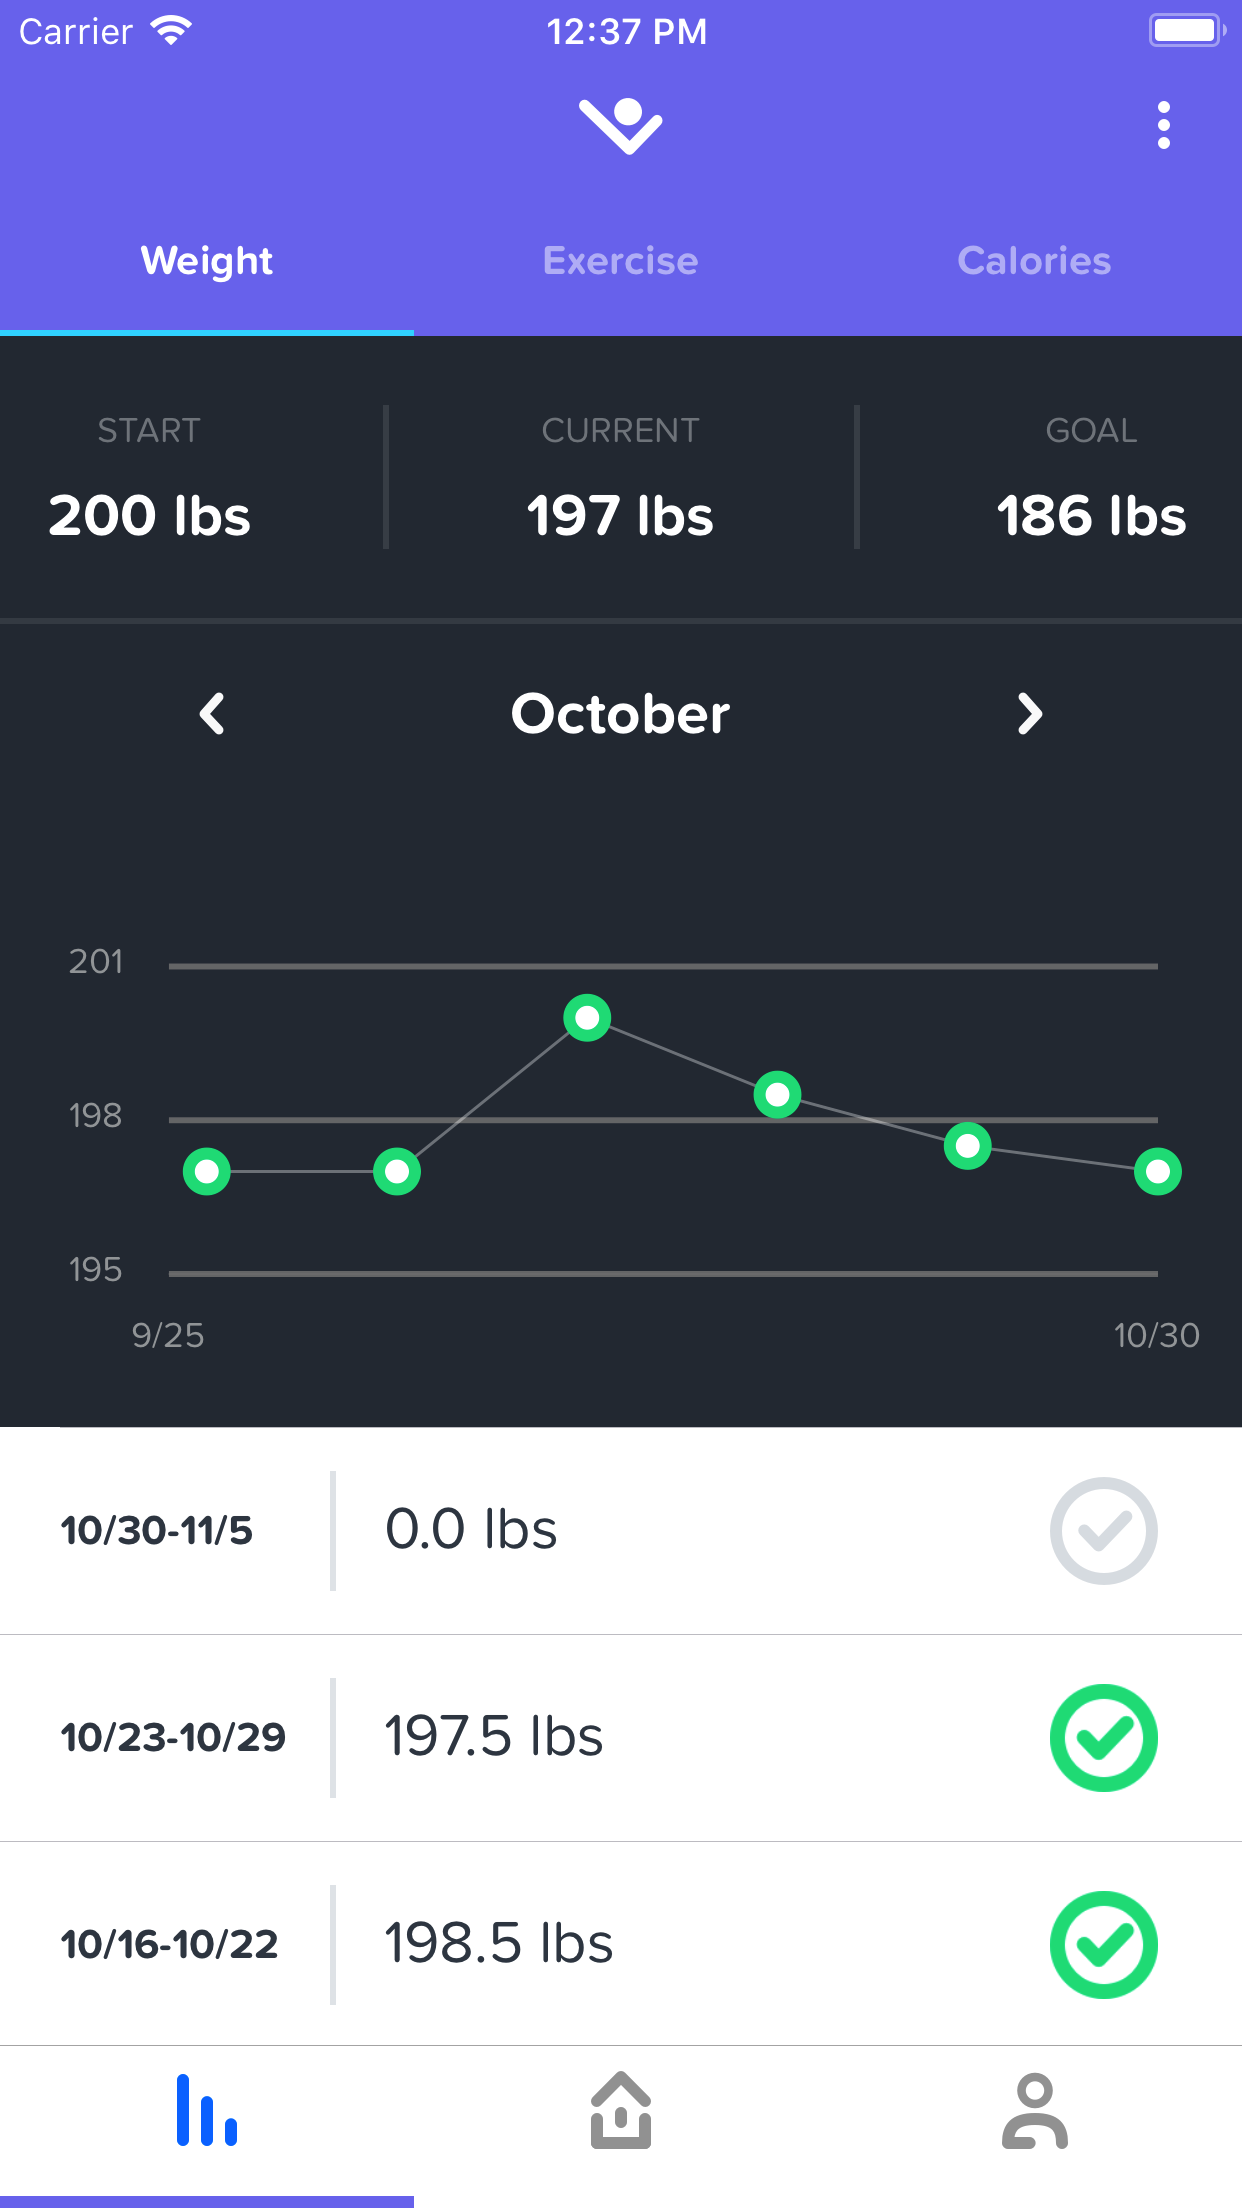
When the view controller loads for the first time, the chart data displays as expected with the range of weights up the y-axis and all the dates within a month displayed along the x-axis (see above image). However, if I pull to refresh the data for the displayed month or if I navigate to a different month and then return to the first chart that was displayed, most of the dates along the x-axis are missing. The only labels which appear are for the first and last record. All the data points are there but the labels are empty strings despite the array used for the display of the x-axis labels contains all the strings (see below image).
Here is a sample of the code within the cell that I am using to draw the chart:
`{
private func lineChartUpdate(data: [WeightRecord]) {
var xAxisLabels = [String]()
var isDataAvailable: Bool {
get {
let averageArray = data.map { $0.average }
for value in averageArray {
if value != nil {
return true
}
}
return false
}
}
guard isDataAvailable else {
emptyStateLabel.isHidden = isDataAvailable
lineChartView.isHidden = !isDataAvailable
return
}
var highestAverage:Double = 0.0
var lowestAverage:Double = 0.0
for record in data {
// Remove the trailing -mm/dd from the string so only 10/27 (for example) appears on the axis
if let week = record.week {
var xAxisString = week
if let range = xAxisString.range(of: "-") {
xAxisString.removeSubrange(range.lowerBound.. highestAverage {
highestAverage = average
}
if average < highestAverage {
lowestAverage = average
}
}
}
// Ensure lowestAverage != 0
if lowestAverage == 0 { lowestAverage = highestAverage.rounded(.up) - 4 }
// Set points on the chart
var lineChartEntries = [ChartDataEntry]() // data for line chart
for (index, record) in data.enumerated() {
let entry = ChartDataEntry(x: Double(index), y: Double(record.average ?? currentWeight))
lineChartEntries.append(entry)
}
let weightLineDataSet = LineChartDataSet(values: lineChartEntries, label: "")
weightLineDataSet.colors = [NSUIColor.leanrGreyVeryLight.withAlphaComponent(0.4)]
weightLineDataSet.circleColors = [NSUIColor.leanrGreenTealish]
// Create data and add to chart
chartData = (isDataAvailable) ? LineChartData() : nil
chartData?.addDataSet(weightLineDataSet)
chartData?.setDrawValues(false)
lineChartView.data = (weightLineDataSet.entryCount != 0) ? chartData : nil
lineChartView.isHidden = weightLineDataSet.entryCount == 0
self.emptyStateLabel.isHidden = weightLineDataSet.entryCount != 0
// format axes
let rightAxisY = lineChartView.rightAxis
rightAxisY.xOffset = 40.0
rightAxisY.enabled = false
let leftAxisY = lineChartView.leftAxis
leftAxisY.labelFont = UIFont.init(name: "ProximaNovaSoft-Regular", size: 12.0)!
leftAxisY.labelTextColor = UIColor.leanrGreyCool
leftAxisY.drawAxisLineEnabled = false
leftAxisY.drawGridLinesEnabled = true
leftAxisY.gridLineWidth = 2.0
leftAxisY.drawTopYLabelEntryEnabled = true
leftAxisY.labelCount = 3
// Configure y-axis
let yAxisVariance = highestAverage.rounded(.up) - lowestAverage.rounded(.down)
leftAxisY.axisMinimum = lowestAverage.rounded(.up) - yAxisVariance
leftAxisY.axisMaximum = highestAverage.rounded(.up) + yAxisVariance
leftAxisY.granularityEnabled = true
leftAxisY.granularity = yAxisVariance // Value interval between gridlines
leftAxisY.xOffset = 15.0
// Configure x-axis
let xAxis = lineChartView.xAxis
xAxis.labelPosition = .bottom // Set labels at bottom
xAxis.yOffset = 15.0 // spacing between labels and bottom gridline
xAxis.labelFont = UIFont.init(name: "ProximaNovaSoft-Regular", size: 12.0)!
xAxis.labelTextColor = UIColor.leanrGreyCool
xAxis.drawGridLinesEnabled = false // hide vertical gridlines
xAxis.valueFormatter = IndexAxisValueFormatter(values: xAxisLabels) // set labels
xAxis.forceLabelsEnabled = true
xAxis.setLabelCount(xAxisLabels.count, force: true) // Force labels to appear even if no data
xAxis.spaceMin = 0.2 // space between axisLeftY and first chart value
// format lineChartView
lineChartView.chartDescription = nil // remove text at bottom right of chart
lineChartView.legend.enabled = false // hide the legend at bottom left of chart
lineChartView.minOffset = 20.0 // padding around the chart
lineChartView.setScaleEnabled(true)
//lineChartView.notifyDataSetChanged()
}
`
NOTE: I've commented out lineChartView.notifyDataSetChanged() because only the first and last labels appear if that function is called - even on the first load.
I've tried setting chart data to nil and calling notifyDataSetChanged() in the cells prepareForReuse() thinking some settings may be maintained when the cell is dequeued but I see the same result.
I'm sure there is an easy fix that I am overlooking but I have been unable to solve this. Any assistance you might be able to provide would be most appreciated.
Finally, kudos to the team for creating a great library. It is exceedingly helpful and has saved numerous hours!
Contributor guide
Assessment
This issue has not been assessed yet.