xAxis labels not showing properly on large bar charts
- Dominant language
- Swift
- Stars
- 28k
- Forks
- 6k
- PR merge metrics
- No merged PRs in 30d
Description
I have a bar chart which has bars each representing a day. The bar chart is in a scroll view which resizes so that the bar widths stay the same no matter the number.
The xAxis values display correctly when the number of bars is under around 35 but then as the charts get larger the xAxis values display less frequently, starting from showing alternate days then every 3 days etc as the number of bars increase.
my code I use to set my labels is:
`barChart.xAxis.valueFormatter = IndexAxisValueFormatter(values:dataPoints)
barChart.xAxis.granularity = 1
barChart.xAxis.granularityEnabled = true
barChart.xAxis.drawGridLinesEnabled = false
barChart.xAxis.setLabelCount(spendDayDates.count, force: false)
barChart.xAxis.wordWrapEnabled = true`
If I changed the bool in the set label count to true then the labels no longer display correctly for any size chart.
heres a screenshot of a bar chart with 30 bars displaying the x axis labels as it should:
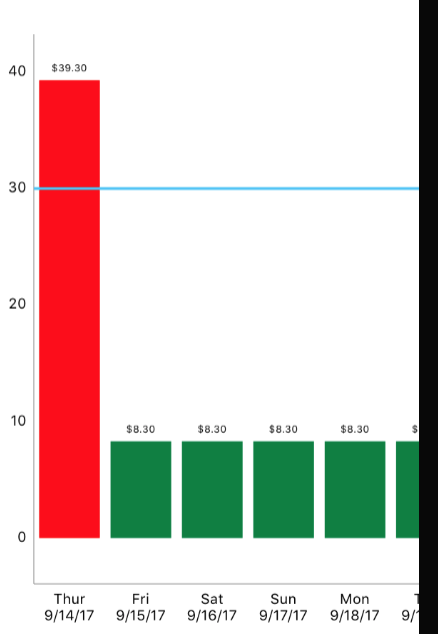
and heres a screenshot of the same chart with 90 bars:

Contributor guide
Assessment
This issue has not been assessed yet.