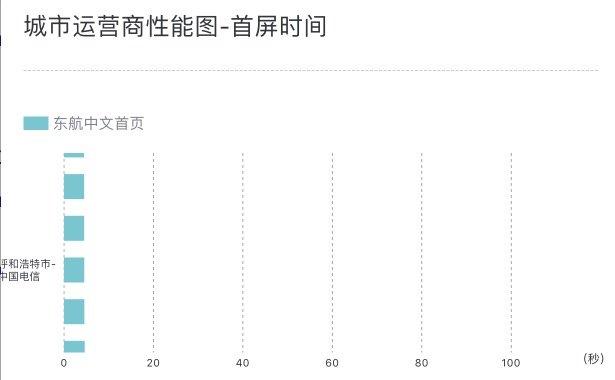
横向直方图,数据太多时,竖轴坐标不显示,坐标字符太长时会溢出边界。
Open
- Dominant language
- Swift
- Stars
- 28k
- Forks
- 6k
- PR merge metrics
- No merged PRs in 30d
Description
在 Charts 2.3.0版本显示是好的。
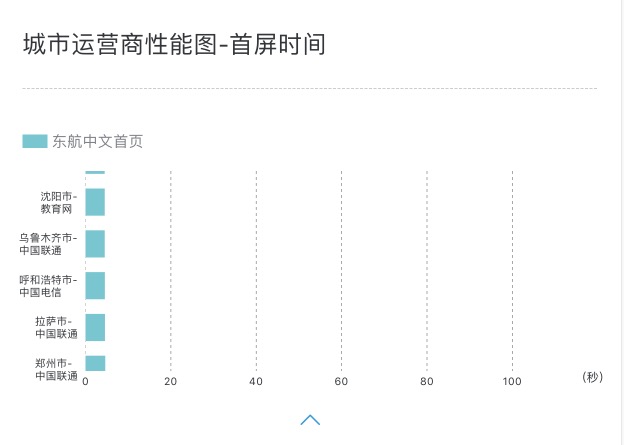
在Charts 3.0.2版本,显示不全。不知道有没有什么方法。
Contributor guide
Research direction
Reproduce the horizontal chart in Charts 3.0.2 with many data entries and long vertical-axis labels, comparing the result with Charts 2.3.0. Done means the axis coordinates remain visible and long coordinate text stays within the chart bounds.
Written by the indexing model from the issue text.
Assessment
- Tech stack
- swift
- Domain
- data-visualization
- Issue type
- Bug
- Difficulty
- 3/5
- Estimated time
- 1-2 days
- Activity status
- Stale
- Clarity
- Mostly clear
- Newbie friendliness
- 35/100