Combined Chart Line chart doesn't change when grouped bars are added
- Dominant language
- Swift
- Stars
- 28k
- Forks
- 6k
- PR merge metrics
- No merged PRs in 30d
Description
I'm trying to make something similar to this

Im going to have 4 BarChartDataSets grouped, and 2 LineChartDataSets, each data set has 7 data points, the user can add or remove these datasets at will
The bars seem to be grouping fine, and the line chart shows all 7 points
but as I add more BarChartDataSets to the chart, the bars go off the right side of the chart, the line chart stays the same, here is an image sequence of me starting with a single LineChartDataSet, then adding BarChartDataSets one by one, some of the bars have a value of 0, so its hard to see the group, look for the 0 label at the bottom
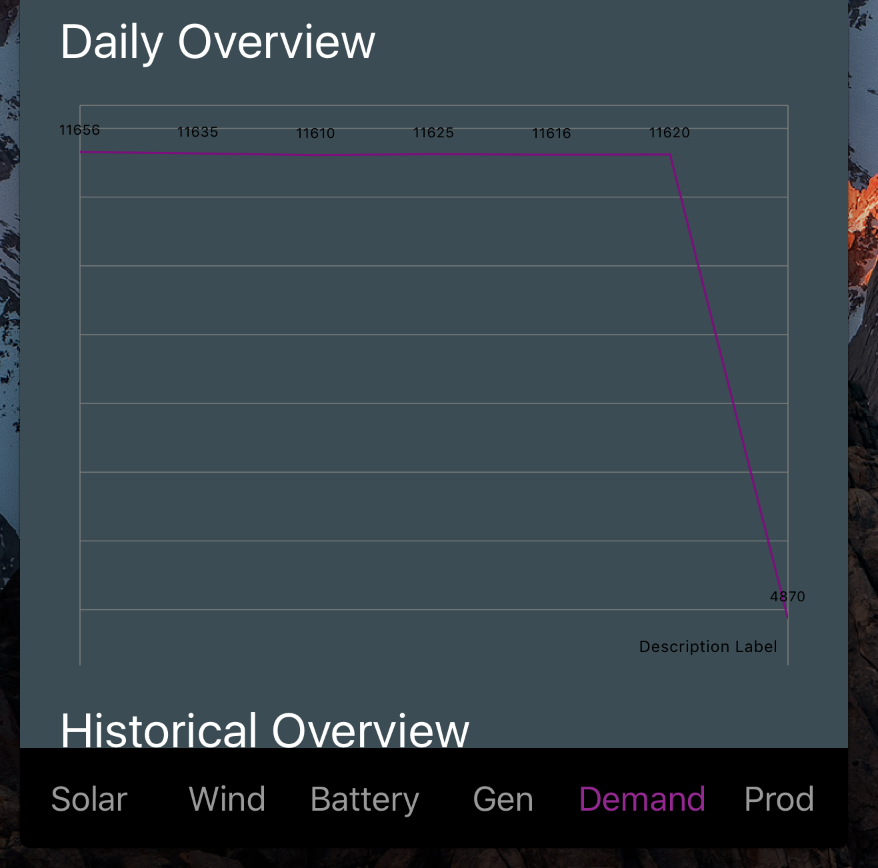
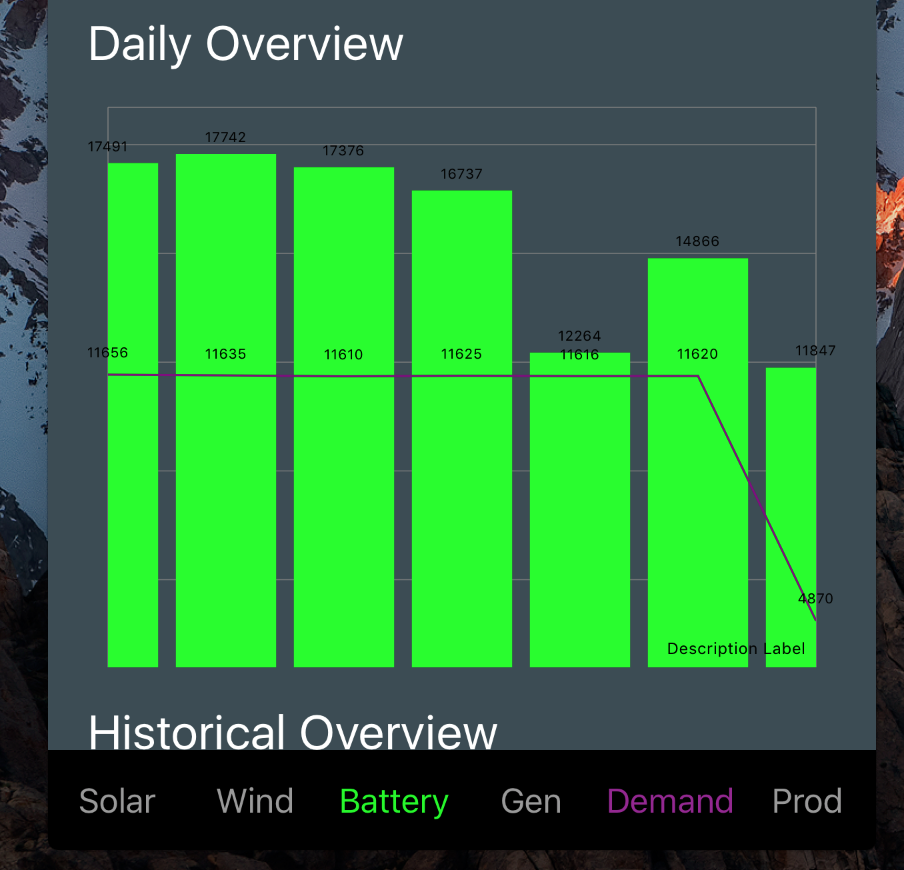
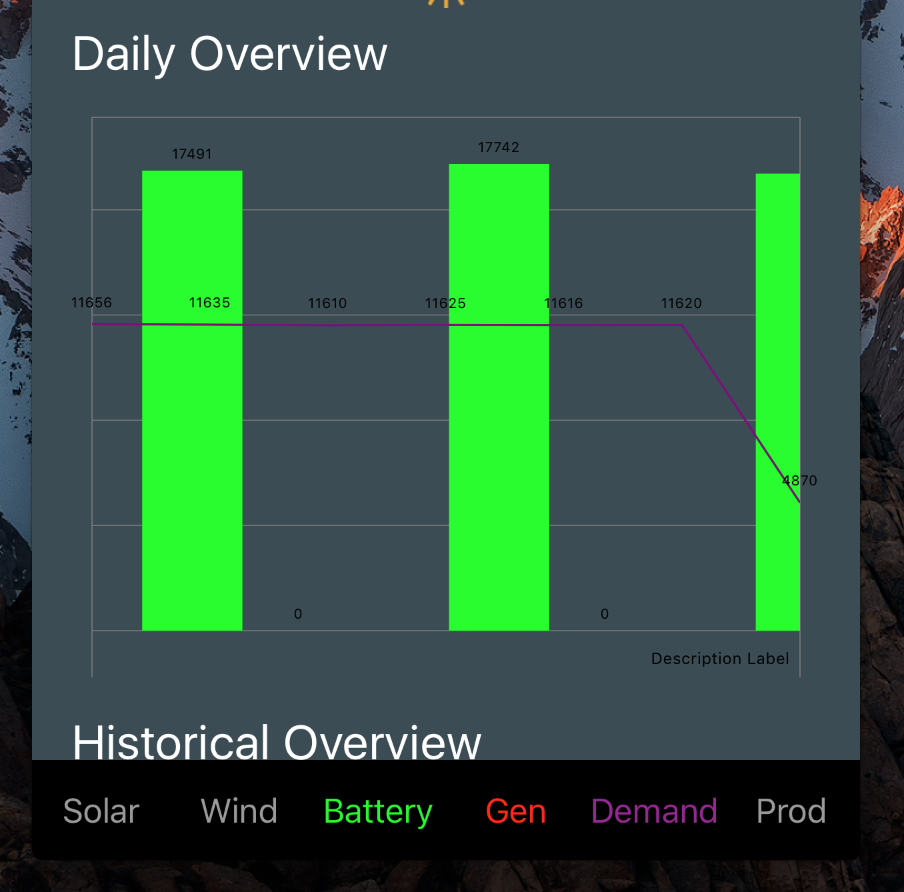
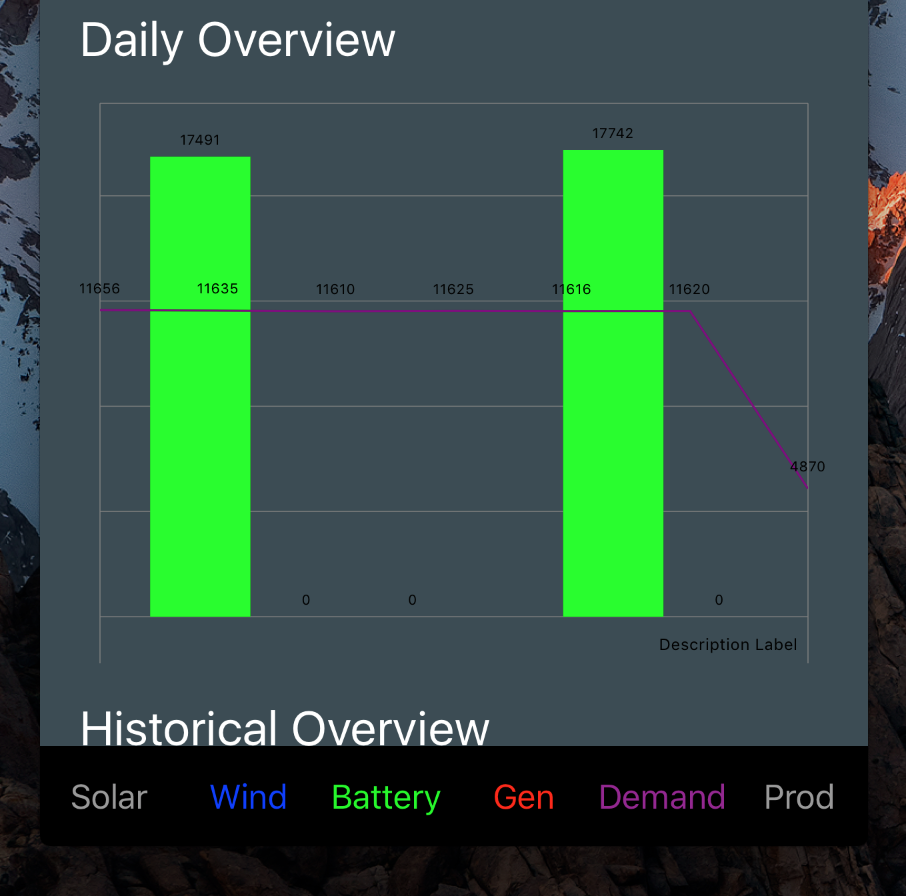
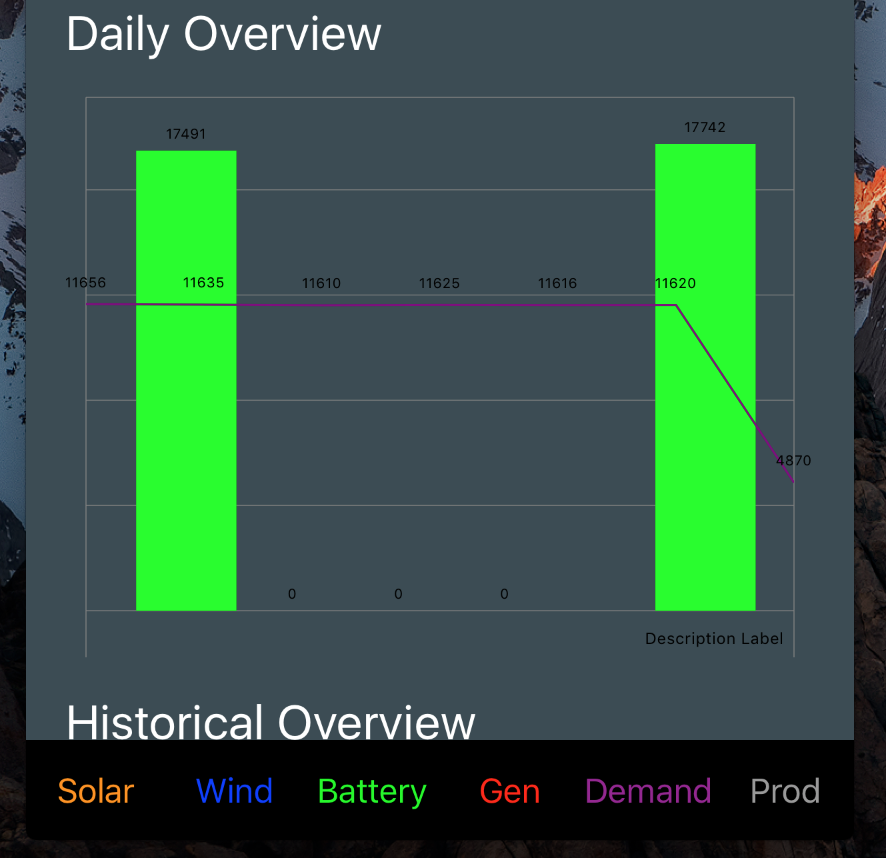
How can i stop the bars from going off the right of the chart?
Contributor guide
Research direction
Start by reproducing the combined chart with one line dataset and progressively added grouped bar datasets, using the screenshots and dataset counts in the issue as the reference. Trace how adding bar datasets updates the chart's horizontal range and layout; done means all grouped bars and line points remain within the chart as datasets are added or removed.
Written by the indexing model from the issue text.
Assessment
- Tech stack
- swift
- Domain
- mobile-dev
- Issue type
- Bug
- Difficulty
- 4/5
- Estimated time
- 3-5 days
- Activity status
- Stale
- Clarity
- Mostly clear
- Newbie friendliness
- 25/100