Azure / Azure/azure-diagnostics-tools
logstash-input-azureblob (0.9.13) Heavy resource usage
- Dominant language
- Ruby
- Stars
- 101
- Forks
- 93
- PR merge metrics
- No merged PRs in 30d
Description
Hi,
I'm using logstash-input-azureblob (0.9.13) to process NSG flow log data from an Azure blob storage account but finding the plugin unusable due to heavy resource usage. We are running logstash with 2 CPU cores and 2gb of JVM Heap size available. Please see monitoring metrics for resource usage (especially CPU Utilisation) with and without the plugin enabled (the plugin was disabled at around 10:20).
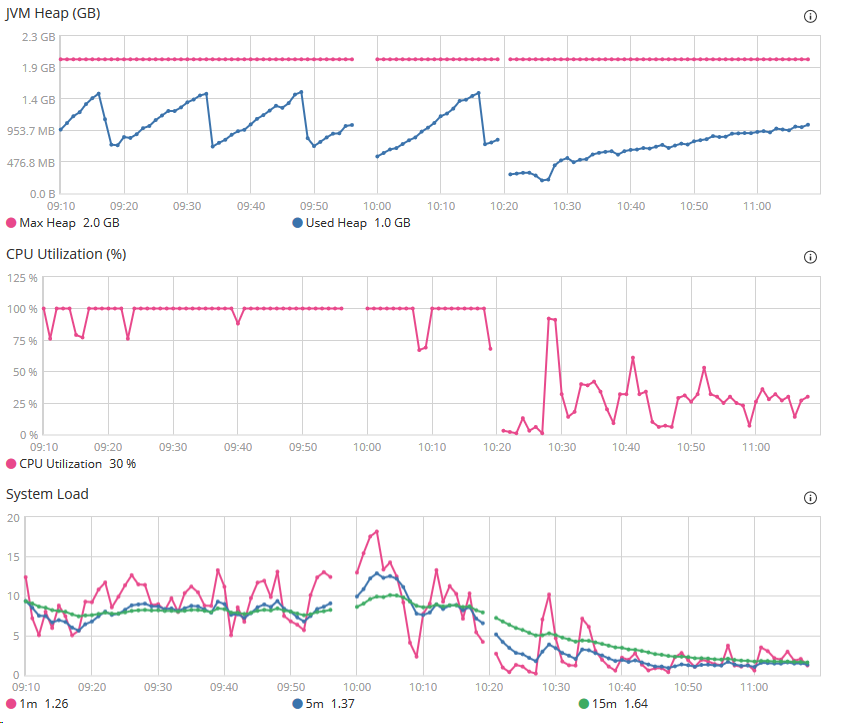
There aren't any error or warning messages in the logs in regards to the plugin to indicate of any issues and the amount of data this pipeline is processing is tiny (no more than 100 per minute).
Is there any reason why the plugin would have such high resource usage or is it just how it normally functions?
Thanks,
Gen.
Contributor guide
No contributing guide indexed for this repository
Assessment
This issue has not been assessed yet.