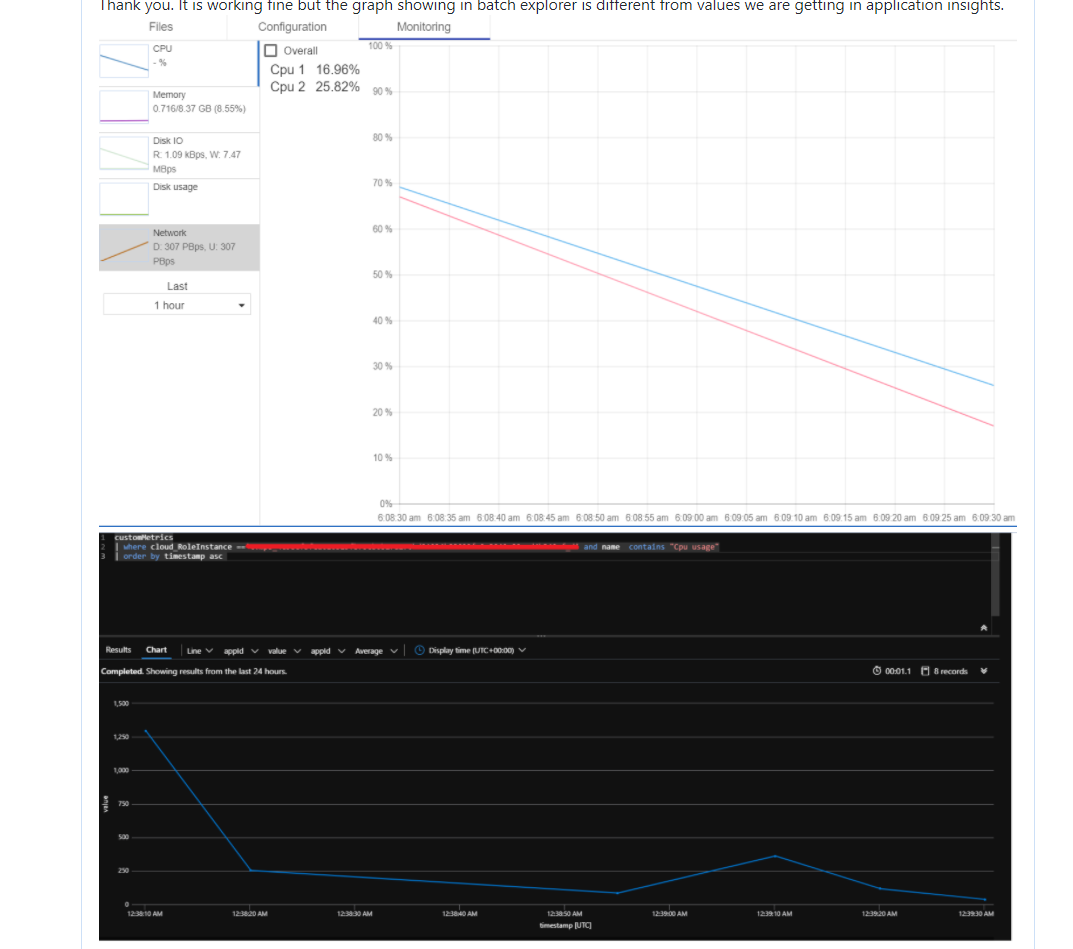
Discrepancy in graph values shown on batch explorer UI and Portal AppInsights UI
- Dominant language
- TypeScript
- Stars
- 205
- Forks
- 75
- PR merge metrics
- No merged PRs in 30d
Description
**Describe the bug**
Discrepancy in graph values shown on batch explorer UI and Portal AppInsights UI.
**To Reproduce**
Steps to reproduce the behavior:
1. Running batch job by placing appinsight key and APP id
2. check on CPU and Memory status on UI
3. Login to portal and check custom metrics in application insight logs.
4. There is difference between graph shows on Batchexplorer UI and Portal UI.
Help me to get the exact details how to check graph and what are the legends need to used.
**Expected behavior**
A clear and concise description of what you expected to happen.
**Screenshots**
If applicable, add screenshots to help explain your problem.
**Logs(Click profile > View Logs > app.log, client.log)**
If applicable please attach those log files
**Version (please complete the following information):**
- OS: [Ubuntu]
- Version 16-04-lts
Contributor guide
Assessment
This issue has not been assessed yet.